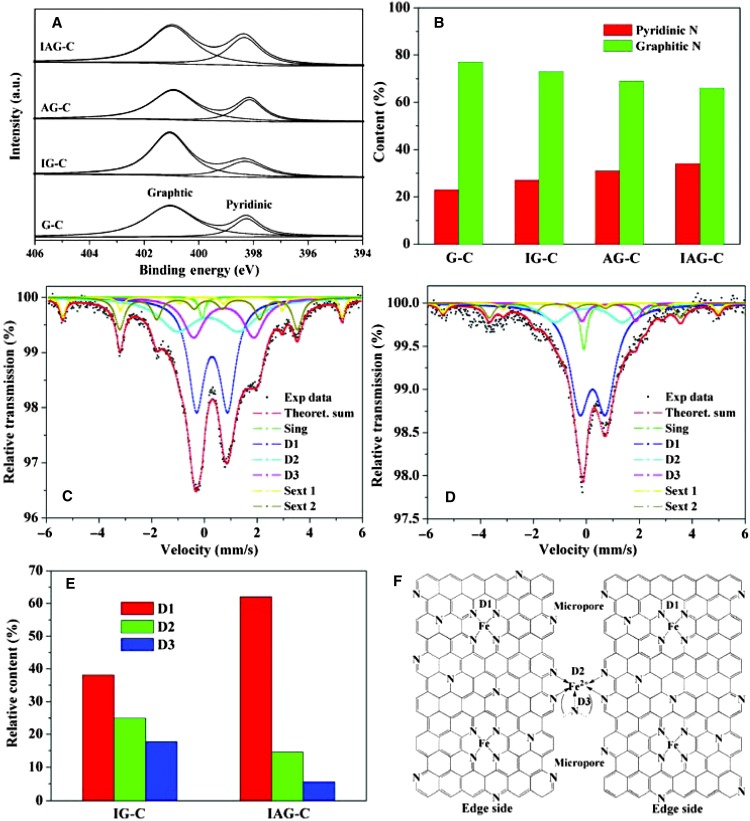
Fig. 4.
(A and B) N 1s XPS spectra (A) and the relative content of pyridinic and graphitic N (B) in the four samples prepared with different precursors. (C and D) Mössbauer spectra for IG-C and IAG-C. (E) Relative content of D1, D2, and D3 sites in all the Fe species for both Fe-containing catalysts. (F) Possible structure model of IAG-C.

