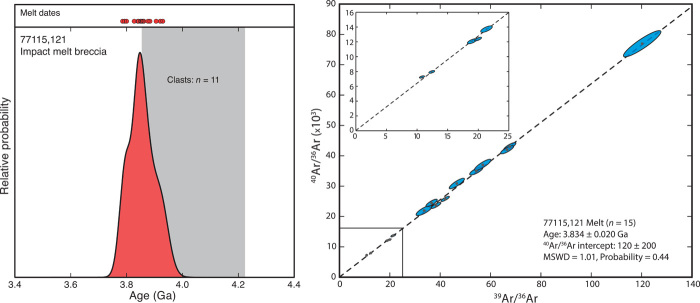
Fig. 2. UVLAMP 40Ar/39Ar results for 77115,121.
(A) Summed PDP of melt dates (red) with individual dates depicted as small red circles above. The gray region represents the range of dates obtained for clasts in 77115,121. (B) Isotope correlation plot of 40Ar/36Ar versus 39Ar/36Ar and linear regression (dashed line) for melt analyses in 77115,121. The inset figure is an enlarged plot of the boxed region near the origin. The data have been corrected for the presence of nucleogenic and cosmogenic isotopes (see Materials and Methods for details). Error ellipses and uncertainties are all 2σ.

