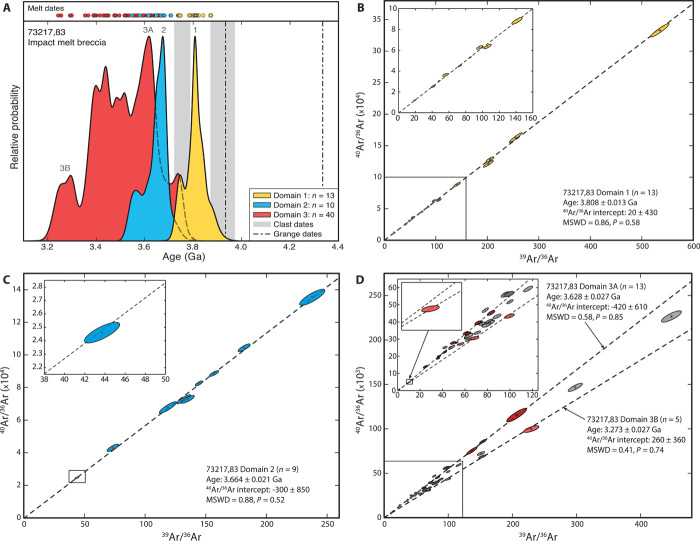
Fig. 3. UVLAMP 40Ar/39Ar results for 73217,83.
(A) Summed PDP of the dates for the three melt domains with individual dates depicted as small colored circles above (yellow, domain 1; blue, domain 2; red, domain 3). Vertical gray bars indicate ranges of two populations of clast dates from 73217,83. The vertical dashed lines indicate U/Pb dates for zircons and phosphates from another section of 73217 interpreted by Grange et al. (2) to represent impact melting events. (B to D) Isotope correlation plots of 40Ar/36Ar versus 39Ar/36Ar with linear regressions shown as dashed lines. Inset figures are enlarged plots of the boxed regions in their parent figures. The data have been corrected for the presence of nucleogenic and cosmogenic isotopes (see Materials and Methods for details). Error ellipses and uncertainties are all 2σ. (B) Isotope correlation plot for analyses in domain 1. (C) Isotope correlation plot of domain 2 analyses. Note: The one analysis that was rejected as an outlier is not shown (see the text for details). It would plot below the regressed line, up and to the right outside of the present bounds. (D) Isotope correlation plot of domain 3 data. Points shown as dark red ellipses were selected from mode 3A of the PDP (see the text for details) and regressed (upper line) to constrain the upper bound of the range of apparent ages measured for domain 3. Points shown as light red ellipses were selected from mode 3B of the PDP and regressed (lower line) to constrain the lower bound of the range of apparent ages for domain 3. The locations of the analyses that constitute modes 3A and 3B are shown in fig. S2. All other data are shown as unfilled ellipses.

