
Fig. 2. Interquartile range of PDSI and soil moisture from the NADA and CMIP5 GCMs, calculated over various time intervals for the Central Plains.
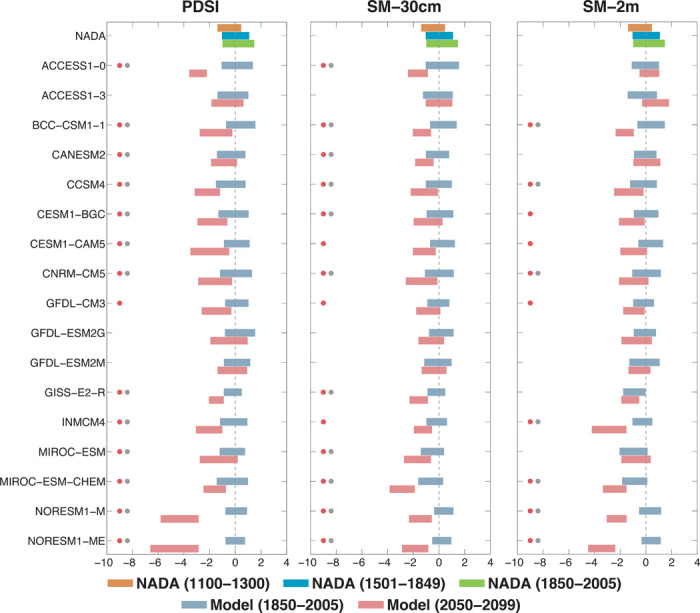
The groups of three stacked bars at the top of each column are from the NADA PDSI: 1100–1300 (the time of the Medieval-era megadroughts, brown), 1501–1849 (the Little Ice Age, blue), and 1850–2005 (the historical period, green). Purple and red bars are for the modeled historical period (1850–2005) and late 21st century (2050–2099) period, respectively. Red dots indicate model 21st century drought projections that are significantly drier than the model simulated historical periods. Gray dots indicate model 21st century drought projections that are significantly drier than the Medieval-era megadrought period in the NADA.