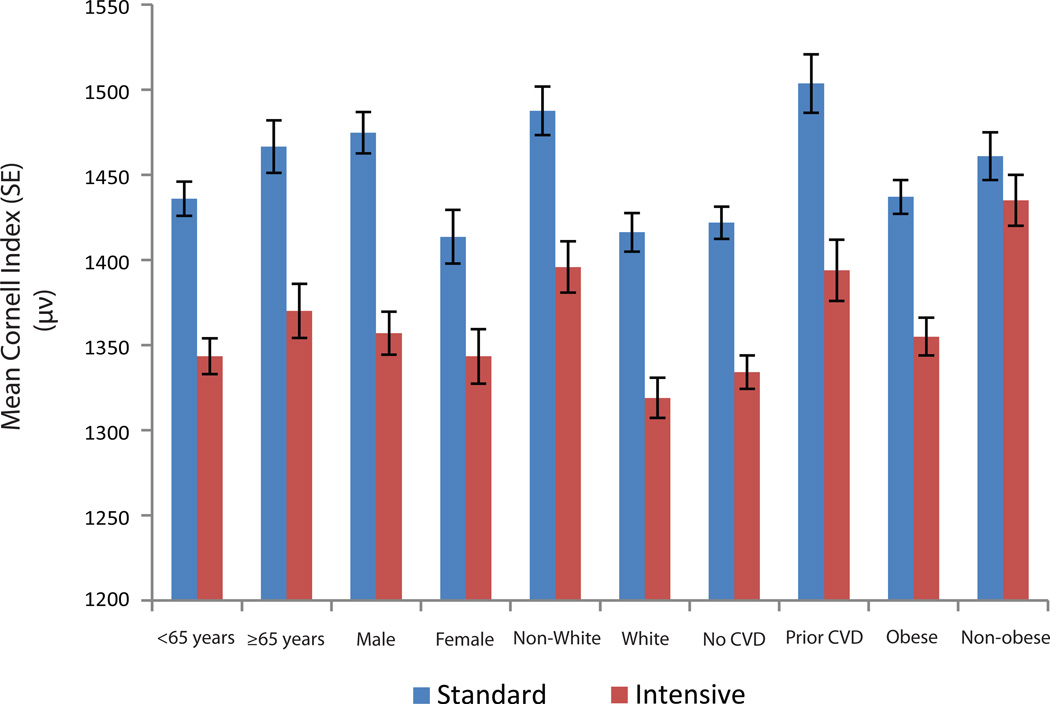
Figure 3.
Effect of intensive vs. standard blood pressure lowering on the mean Cornell index during follow up
All models accounted for the assignment to the intensive glucose lowering intervention and each of the seven clinical center networks. Model was also adjusted for baseline Cornell index values.
p-value for the comparison of adjusted mean Cornell index in standard vs. intensive BP lowering was <0.01 in all subgroups. No significant interaction between subgroups
Cornell index is defined as the sum of the R amplitude in aVL and S amplitude in V3 in microvolt

