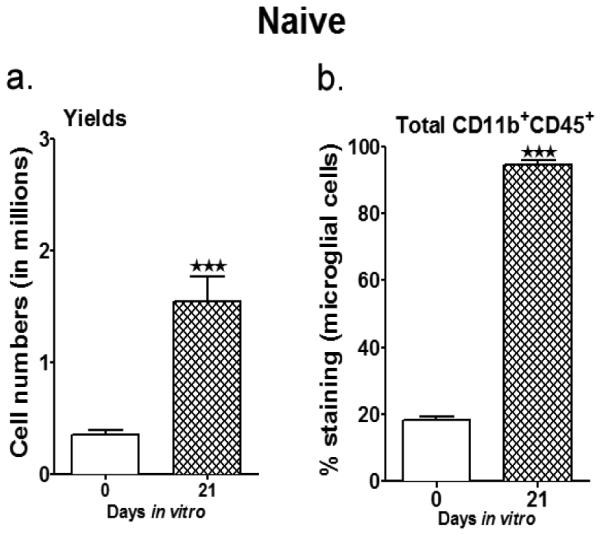
Fig. 1. Yield and purity of primary microglia cultures isolated from adult naïve mice.

a. Summarizes the harvest yields on the day of MG isolation (mixed glial cells) and then after 21 days in vitro; with mixed glial cells cultured with 5 ng/ml GM-CSF through all the days. b. The purity of the MG was determined by staining for expression of CD11b and CD45. Values are given as mean ± S.E.M. Data presented are representative of n = 8 separate MG isolations and primary culture set-ups for naïve male WT mice. Statistical analysis was performed using Student’s t-test. Significant differences between sample means are indicated as ***P≤0.001 as compared to the values from day of MG isolation
