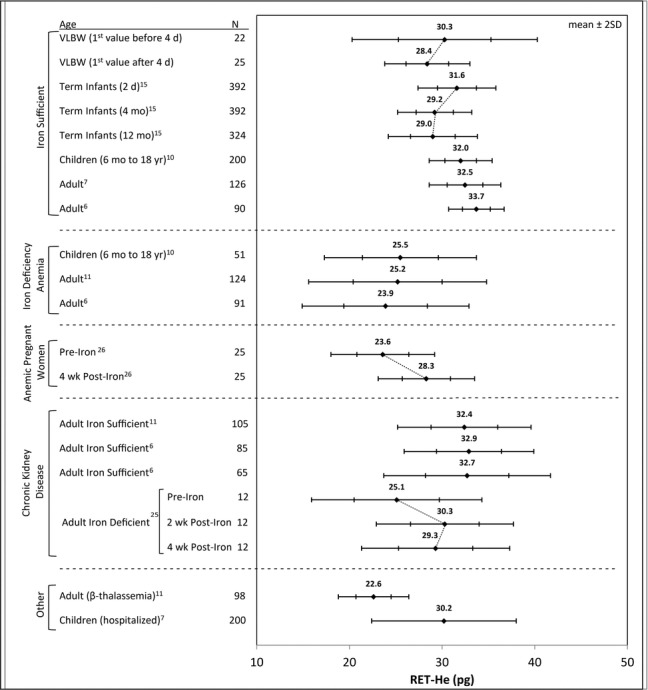
Figure 3.

RET‐He ranges for different patient groups. The filled diamond indicates the mean with the ±1 and ±2 SD range indicated horizontally. The diagonal lines connecting different age groups indicate paired longitudinal data for the same study groups. The different subject groups include iron‐sufficient subjects at different developmental periods, IDA, pregnant women, chronic kidney disease subjects receiving r‐HuEPO, and iron treatment, and two other groups, that is, those with β‐thalassemia and hospitalized children with diverse medical conditions.
