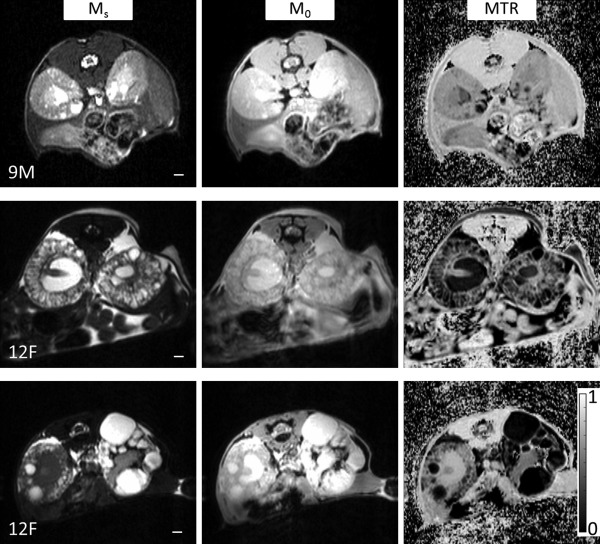
Figure 1.

Examples of three different specimens imaged by MRI. Left column: MT images obtained with saturation on (Ms). Middle column: MT images obtained with saturation off (M0). Right column: Calculated MTR maps (computed as defined by Equation (1)). The three examples were chosen to highlight the wide range of observed phenotype expression in the mouse model. The top row highlights a fairly mild presentation of the disease in a 9‐month‐old male (KW/BW = 2.2%, cystic index = 5%, fibrotic index = 2%) that had a number of microcysts and a few large exophytic cysts. The middle row shows a much more severe presentation in a 12‐month‐old female (KW/BW = 4.3%, cystic index = 43%, fibrotic index = 10%). The bottom row shows asymmetric presentation in a 12‐month‐old female in which the left kidney presented much more severely than the right kidney (KW/BW = 5.3%, cystic index = 57%, fibrotic index = 9%). A color bar for the MTR images is displayed at bottom right. Scale bar = 1 mm.
