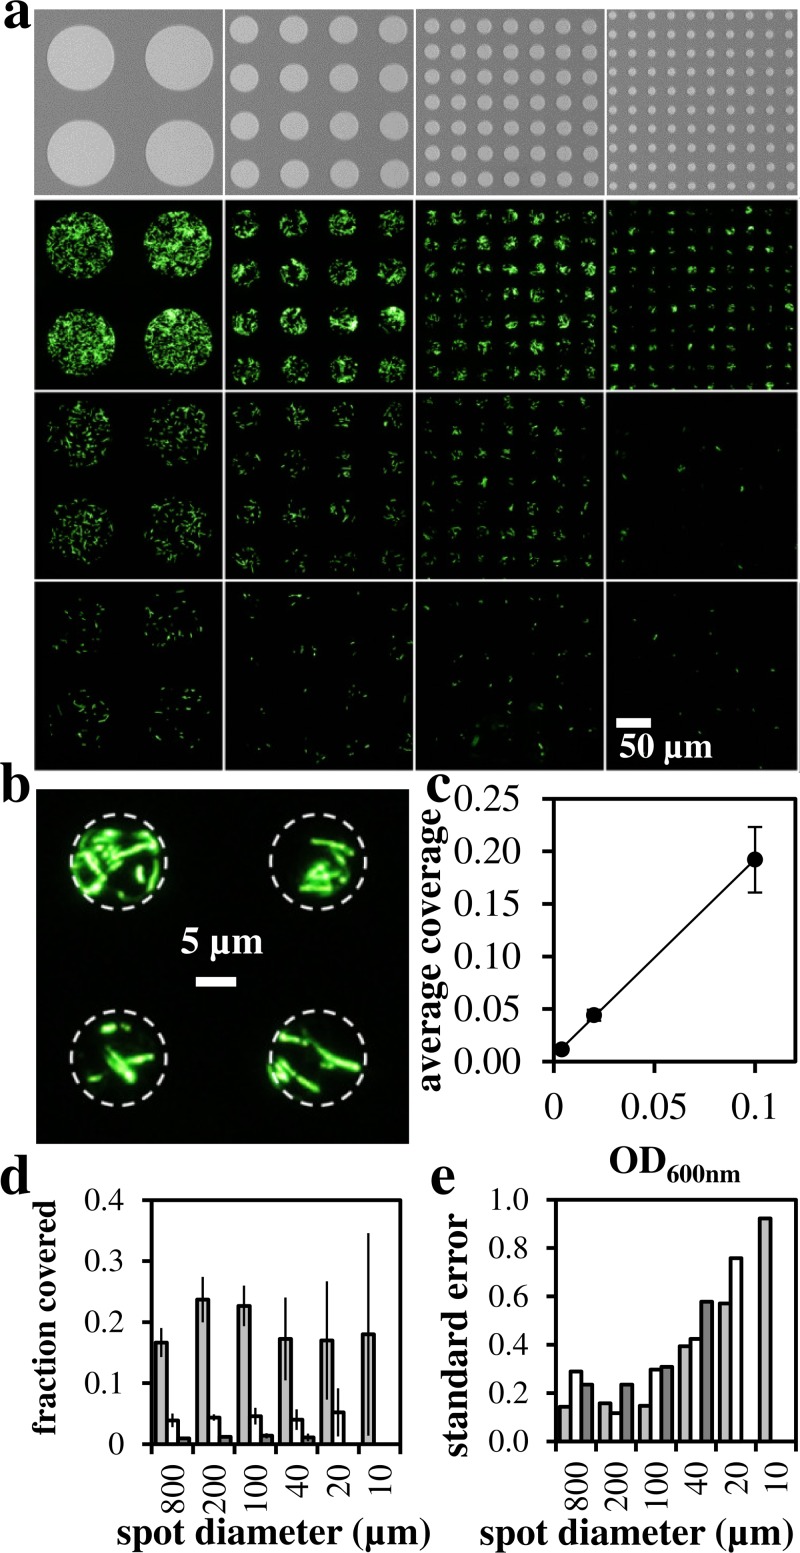
FIG. 2.
Microfluidic delivery of bacteria to surface. (a) SEM images of spot array target (top) and fluorescent microscopy images of patterned GFP-labeled E. coli. Culture density was decreased from top to bottom using OD600 nm = 0.1, 0.02, 0.004. Spot diameter in microns (left–right): 100, 40, 20, 10. (b) High resolution image of patterned GFP-E. coli cells (OD600 nm = 0.1, 10 μm diameter). (c) Quantification of delivery vs. inoculum optical density. (d) Quantification of delivery as measured by fraction of spot covered. Gray bars: OD600 nm = 0.1, white bars: OD600 nm = 0.02, black bars: OD600 nm = 0.004. (e) Variability in spot coverage as standard error = standard deviation/mean.

