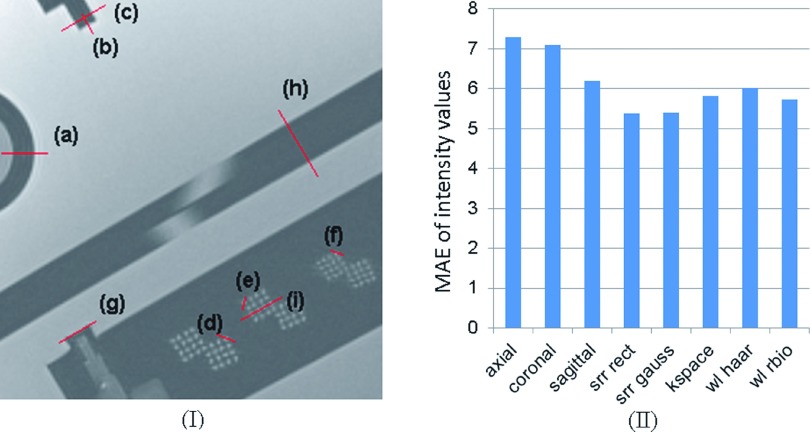
FIG. 6.
(I) visualizes the position of designated intensity profile lines (a)–(i) on the selected reference MR slice of the ACR phantom; the intensity profiles are shown in Fig. 7. (II) shows the MAE of intensity values between the reference intensity profile and the intensity profile of each image. This analysis indicates that image-based SRR performs the best among others.

