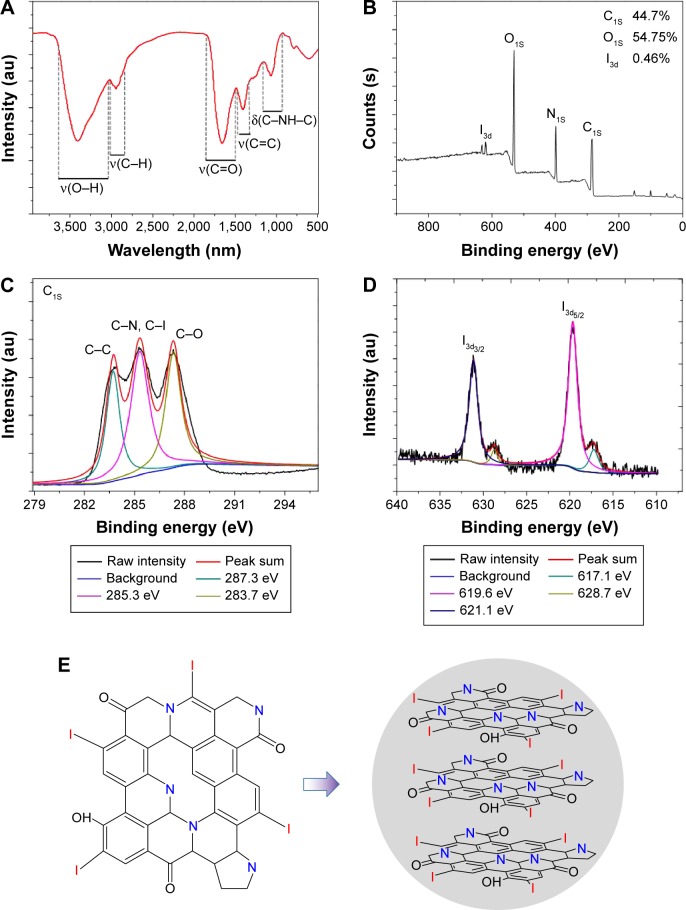
Figure 3.
The chemical structure and composition of the I-doped CDs.
Notes: (A) The FTIR spectrum of I-doped CDs. (B) The full-scan XPS spectrum of I-doped CDs. (C) C1S spectrum. (D) I3d spectrum. (E) A potential schematic illustration of doped iodine atom into the carbon particles.
Abbreviations: FTIR, Fourier transform infrared spectroscopy; I-doped CDs, iodine-doped carbon dots; XPS, X-ray photoelectron spectroscopy.

