Figure 4.
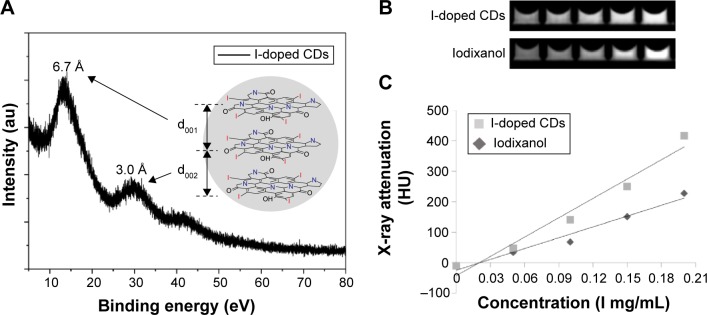
XRD patterns and radio-opacity of the I-doped CDs.
Notes: (A) XRD patterns of the I-doped CDs. The inset represents the heterogeneous multilayer of the I-doped CDs, corresponding to characteristic diffraction peaks. (B) In vitro CT imaging of the I-doped CDs with different iodine concentrations from 0.05 to 0.2 mg/mL. (C) The measured CT value of the five samples as a function of iodine concentration.
Abbreviations: XRD, X-ray diffraction; I-doped CDs, iodine-doped carbon dots; CT, computed tomography.

