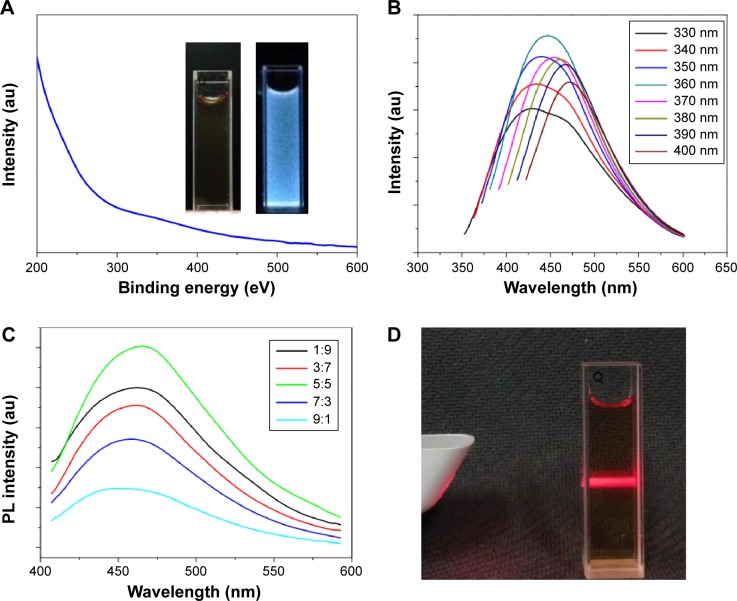
Figure 5.
The optical properties of the I-doped CDs.
Notes: (A and B) UV–Vis absorbance and PL emission spectra of the I-doped CDs, respectively. The inset of (A) shows a diluted aqueous solution containing the as-prepared I-doped CDs. The PL emission spectra show the results of using progressively longer excitation wavelengths, from 330 to 400 nm in 10 nm increments. (C) The effect of molar ratio of glycine and iodixanol on the PL intensity. (D) The Tyndall effect exhibited by the I-doped CDs in aqueous solution.
Abbreviations: I-doped CDs, iodine-doped carbon dots; UV–Vis, ultraviolet–visible; PL, photoluminescence; Q, quartz.

