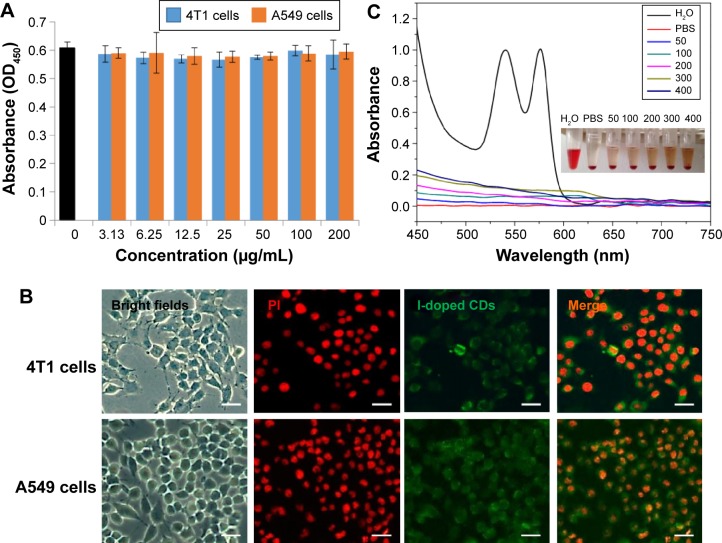
Figure 6.
The charaterization of the I-doped CDs biocompatibility.
Notes: (A) Effect of I-doped CDs on the viability of 4T1 and A549 cells using the MTS assay. (B) Laser scanning confocal microscopy images of 4T1 and A549 cells stained with potassium iodide and I-doped CDs (scale bars =50 μm). (C) Hemolytical activity of the I-doped CDs at different concentrations (50, 100, 200, 300, and 400 μg/mL). PBS and water were used as negative and positive control, respectively.
Abbreviations: OD, optical density; I-doped CDs, iodine-doped carbon dots; PBS, phosphate buffer saline; MTS, 3-(4,5-dimethyl-thiazol-2-yl)-5-(3-carboxymethoxyphenyl)-2-(4-sulfophenyl)-2H-tetrazolium.

