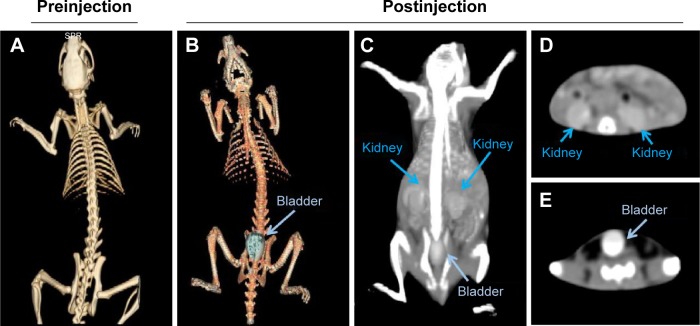
Figure 7.
The X-ray CT imaging of I-doped CDs in vivo and in vitro.
Notes: 3-D X-ray CT imaging of rats before (A) and after (B) intravenous injection of I-doped CDs (40 mg/kg). In vivo CT imaging and analysis of rats after intravenous injection of I-doped CDs (C–E). Blue arrows represent kidney; gray arrows represent bladder.
Abbreviations: CT, computed tomography; I-doped CDs, iodine-doped carbon dots; 3-D, three dimensional.

