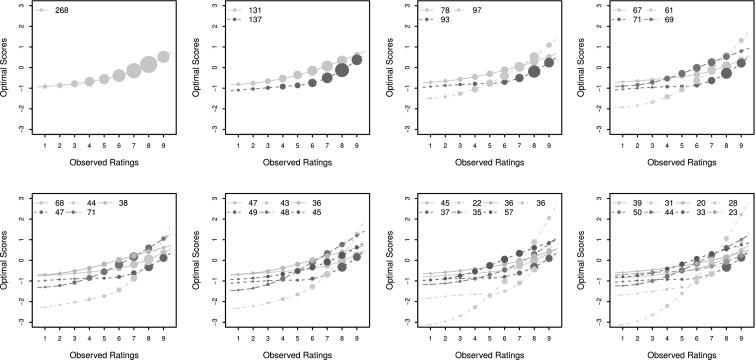
Fig. 8.
The estimated response mappings for (top left) to 8 (bottom right) groups, respectively. The area of the bubbles are proportional to how often that particular rating is used. The group sizes are also shown in a legend. Groups are labelled sequentially; the legend should be read vertically and then horizontally.

