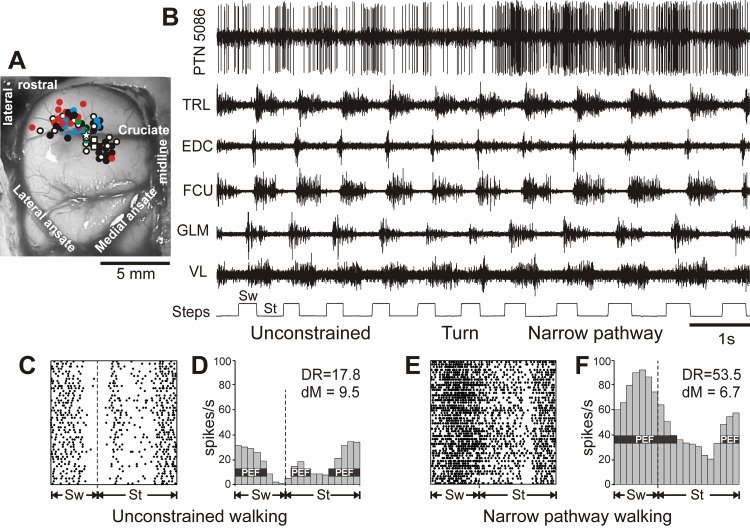
Fig. 2.
The area of recording in the motor cortex and an example of the activity of a neuron along with selected muscles during unconstrained and narrow-path walking. A: areas of recording in the left motor cortex. Microelectrode entry points into the cortex were combined from all cats and are shown as circles on the photograph of cat Mc cortex: cat Mc entry points are depicted by white symbols, while those of cats Ba, Ko, Va, and Zv are shown by red, blue, green, and black symbols, respectively. Squares designate tracts where neurons with receptive fields spanning both the fore- and hindlimb were recorded. The star marks the track from which the neuron's activity shown in fragments B–F was recorded. B–F: an example of the activity of a neuron [pyramidal tract neuron (PTN)5086] and selected right fore- and hindlimb muscles during unrestrained and narrow-path walking. B: activity of the neuron and muscles during walking first with unconstrained paw placement and then, after a turn, along the narrow path. Bottom trace shows the swing (Sw) and stance (St) phases of the step cycle of the right forelimb that is contralateral to the recording site in the cortex. TRL, triceps brachii lateral head; EDC, extensor digitorum communis; FCU, flexor carpi ulnaris; GLM, gluteus medius; VL, vastus lateralis. C and D: the activity of the same neuron during unconstrained walking is presented as a raster of 50 step cycles (C) and as a frequency distribution histogram (D). The duration of step cycles is normalized to 100%. Vertical dashed lines indicate the end of the swing and the beginning of the stance phase. In the histogram, the horizontal black bar shows the period of elevated firing (PEF) as defined in methods. The average discharge rate (DR, spikes/s) and the depth of frequency modulation (dM, %) are shown. E and F: the raster and distribution of the activity of the same neuron during narrow-path walking.

