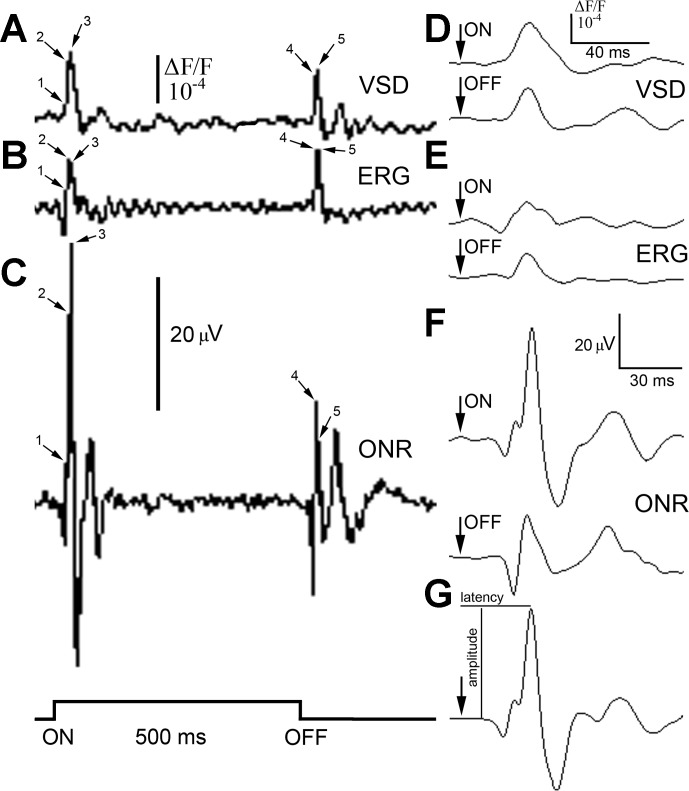
Fig. 2.
Responses (mean of n = 3) to the onset (ON) and termination (OFF) of a 500-ms, 380-nm light stimulus of suprathreshold intensity (2.5 × 10¹³ photons cm−2s−1), recorded using electrode or optical means from the rainbow trout visual system. A–C: recordings, from the same fish, of optical activity at the level of the optic tectum using the RH-414 VSD (A), an ERG (B), and the ONR recorded with an electrode inserted through the optic tectum into the optic nerve (C). The step trace at the bottom left of the figure shows the stimulus time course. Before recordings, the fish was adapted to a dim, full-spectrum light background [4.6 × 10¹² photons cm−2s−1; wavelength (λ): 380–740 nm]. Time points 1–5 indicate several components of the ON (1–3) and OFF (4 and 5) responses that occurred in all traces. D–F: at 10-fold temporal resolution, the ON and OFF responses showed a single, main peak associated with the first upward deflection (consisting of components 2 and 3 in A–C), as illustrated for the VSD (D), ERG (E), and ONR (F) traces. The arrow on each trace indicates the onset or termination of the light stimulus. The main ON response peak occurred at 35 ms (VSD), 33 ms (ERG), and 34 ms (ONR) following the onset of the light stimulus. The main OFF response peak occurred at 34 ms (VSD) and 33 ms (ERG and ONR) following termination of the stimulus. G: another ON response, obtained using the ONR technique, to a 380-nm light stimulus, illustrating the measures of amplitude and latency. The scale bars with amplitude in microvolts apply to corresponding ERG and ONR traces (B, C, and E–G), and those denoting increment fluorescence above background (ΔF/F) correspond to the VSD traces (A and D).

