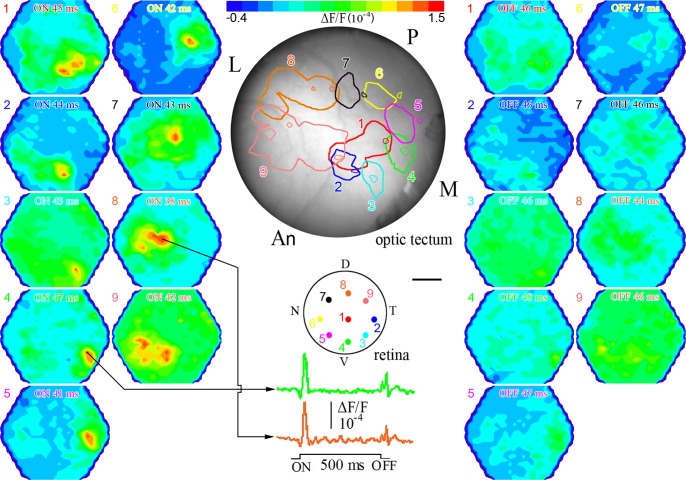
Fig. 3.
Map of retinal ganglion cell afferent input to the contralateral optic tectum derived by optical recordings with the RH-414 VSD. Shown are 2 sets of corresponding pseudocolor images illustrating ON (left) and OFF (right) responses to 9 locations of retinal stimulation. The stimulus was full-spectrum light (λ: 320–740 nm) of 500 ms duration and of suprathreshold intensity (2.8 × 10¹³ photons cm−2s−1). The adapting light background was the same as in Fig. 2. Labeled at the top of each pseudocolor image is the type of response (ON or OFF) and the latency at maximum amplitude of depolarization (see Fig. 2G for measures). At the top of the figure is a bar showing the color range of responses, from hyperpolarization (blue) to depolarization (red). The colored dots on the drawing of the retina illustrate the locations of retinal illumination and are numbered 1–9. Corresponding pseudocolor images are likewise numbered with the color matching that of the latency of the ON and OFF responses. Below the retina drawing, the trace from the diode with maximum ON response is shown for 2 locations of retinal illumination. Color-matched (and numbered) ganglion cell response contours, each comprising the area with ≥50% of the maximum ON response, are mapped onto the surface of the optic tectum (middle, top). Smaller contours within or near larger contours of same color delineate areas with ≥50% of the maximum OFF response. M, medial; P, posterior; L, lateral; An, anterior optic tectum. Scale bar, 0.32 mm (retina) and 0.42 mm (optic tectum). All other symbols are as in Fig. 2.

