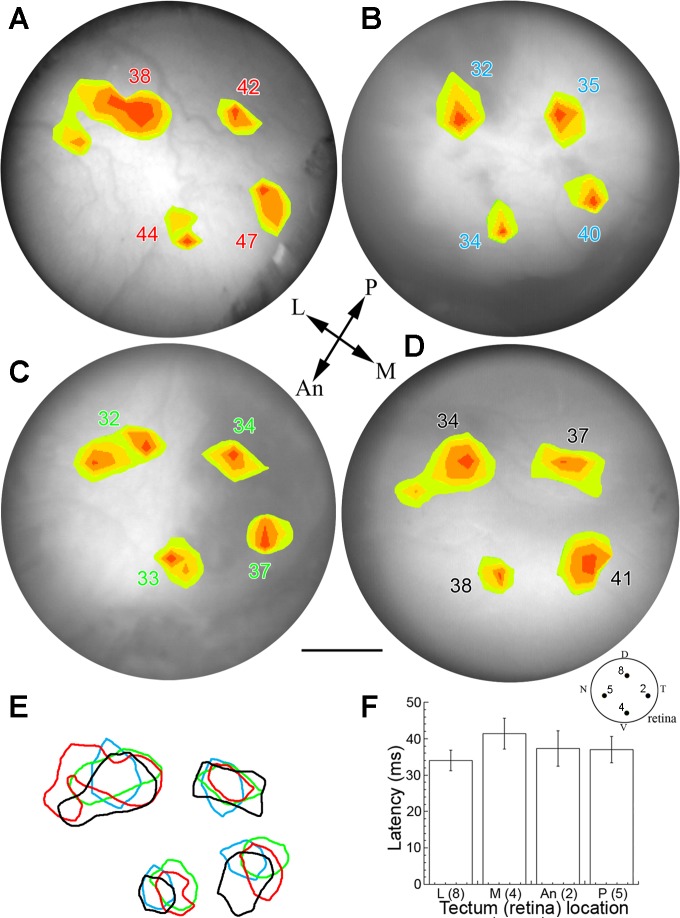
Fig. 4.
Consistency of retinal projections to the optic tectum of juvenile rainbow trout. A–D: pseudocolor response contours mapped onto the optic tectum for each of 4 juvenile rainbow trout. Each pseudocolor area encompasses responses with an amplitude ≥50% of the maximum ON response. The number associated with each contour is the latency of the response. The recording technique, light stimulus, and background adaptation were as in Fig. 3. The 4 locations of retinal stimulation correspond to the D, T, V, and N spots on the retina drawing in Fig. 3 (and reproduced at the bottom right of this figure); these light stimulations resulted in projections to the L, An, M, and P regions of the optic tectum, respectively (reference arrows for optic tectum orientation are shown in the middle of this figure). E: the retinotectal projections were spatiotemporally consistent between fish, as shown by the extensive overlap of corresponding depolarization areas (color-matched to corresponding latencies). F: differences in response latency as a function of illumination area (matching numbers on retinal drawing). The mean latency of the medial projection (ventral retina) is significantly longer than that of the lateral projection (dorsal retina; t-test, α = 0.05). The spatial comparison between fish was achieved by mapping coordinates of each response contour with respect to the medial line separating both tecta and to the posterior end of the optic tectum. Scale bar, 0.72 mm, applies to all panels.

