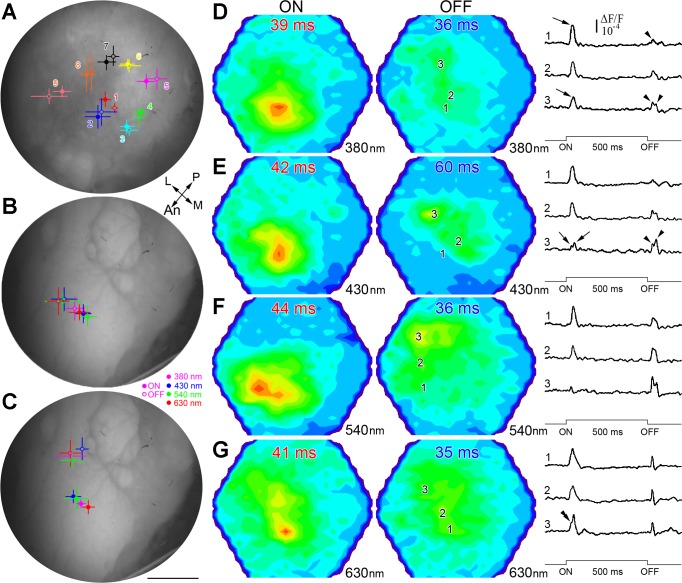
Fig. 5.
Separation of maximal response location between ON and OFF fiber projections to the optic tectum of juvenile rainbow trout. A–C: mean location (n = 4) of ON (full circles) and OFF (rings) maximal responses to: full-spectrum stimulation on the retina (A) as per the conditions in Fig. 3 (numbers and colors of projections match corresponding ones on retinal drawing in Fig. 3), stimulation with various λ (B; 380, 430, 540, or 630 nm; see key at bottom right of panel) under the background conditions of Fig. 3 but using a larger stimulus light guide with a diffuser at its end (this permitted illumination of the entire retina, although a majority of the light was directed at the temporal retina), and same stimulus (C) as per B but following 1-h adaptation of the fish to a >430-nm background, which preferentially adapted the longer wavelength (middle and long) cone mechanisms. Bars around the means are the SDs of the (x, y) coordinates. In each case, means ± SD are mapped onto the surface of a representative optic tectum. Scale bar, 0.75 mm (A–C). D–G: representative pseudocolor image pairs (arranged horizontally) illustrating ON and OFF responses at their respective maxima to a 500-ms suprathreshold light stimulus under the >430-nm background. The characteristics of the light stimulus were λ = 380 nm (2.5 × 10¹³ photons cm−2s−1; D), λ = 430 nm (5.9 × 10¹³ photons cm−2s−1; E), λ = 540 nm (6.8 × 10¹³ photons cm−2s−1; F), and λ = 630 nm (4.7 × 10¹³ photons cm−2s−1; G). Associated with each image pair are response traces corresponding to locations 1–3 in the optic tectum (illustrated on the OFF pseudocolor images only). These traces are for diodes that recorded the maximal ON amplitude (1), maximal OFF amplitude (3), and representative in-between amplitudes (2). The shapes of the ON and OFF responses varied with λ, and the location of the ON and OFF maxima also differed for a given λ. Other presentation and abbreviations are as in Fig. 3.

