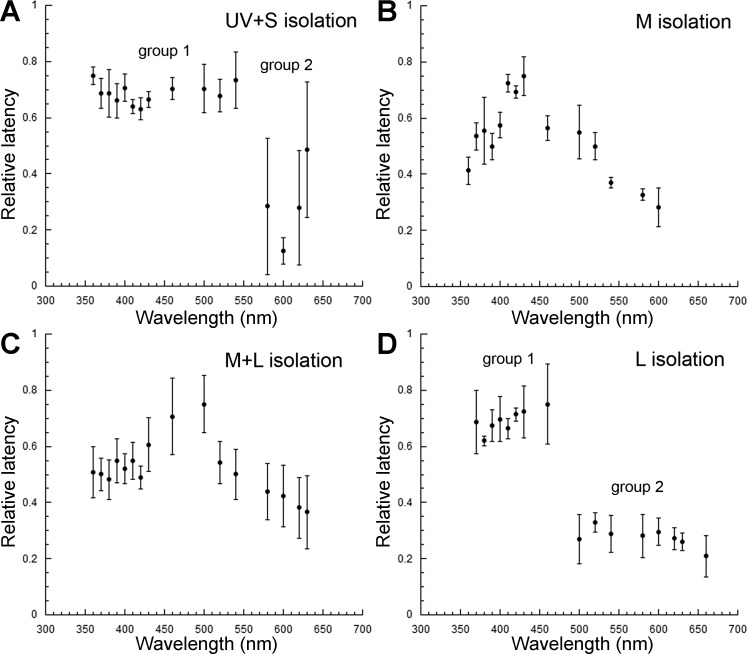
Fig. 9.
Latency of the juvenile rainbow trout OFF response under different light-adapting backgrounds. A–D: relative latency of the OFF response in the case of UV + S (A), M (B), M + L (C), and L (D) cone mechanism isolation. A and D: groups of latencies with statistically different means are assigned different numbers (groups 1 and 2). Statistical difference between latencies for 4 specific λs (380, 420, 520, and 630 nm), represented in all graphs, is shown in Table 2. Each point is the mean ± SD of n = 5 (A and D) and n = 3 (B and C). Adapted, with permission, from Beaudet (1997).

