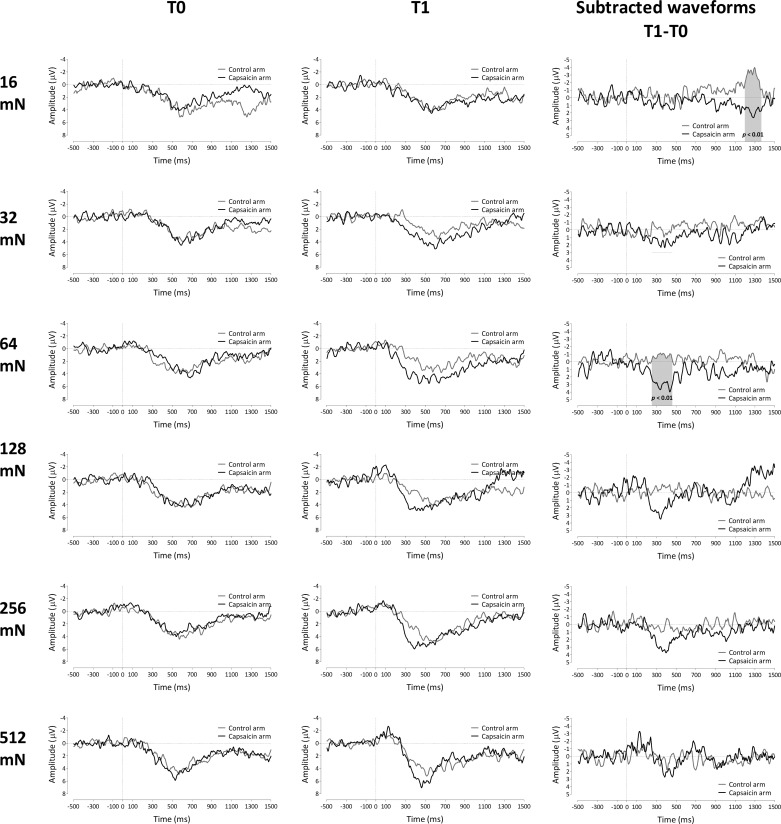
Fig. 8.
Left and center: group-level average ERP waveforms of the signals measured from Pz vs. A1A2, before capsaicin injection (T0; left) and 30 min after capsaicin treatment (T1; center) for both the control arm and the capsaicin-treated arm for each pinprick intensity. Right: group-level average subtracted (T1 − T0) waveforms for the 2 arms (capsaicin treated and control) and each pinprick intensity. Gray shading indicates the time window for which the 2 arms significantly differ after capsaicin treatment (n = 18 for 128 mN).

