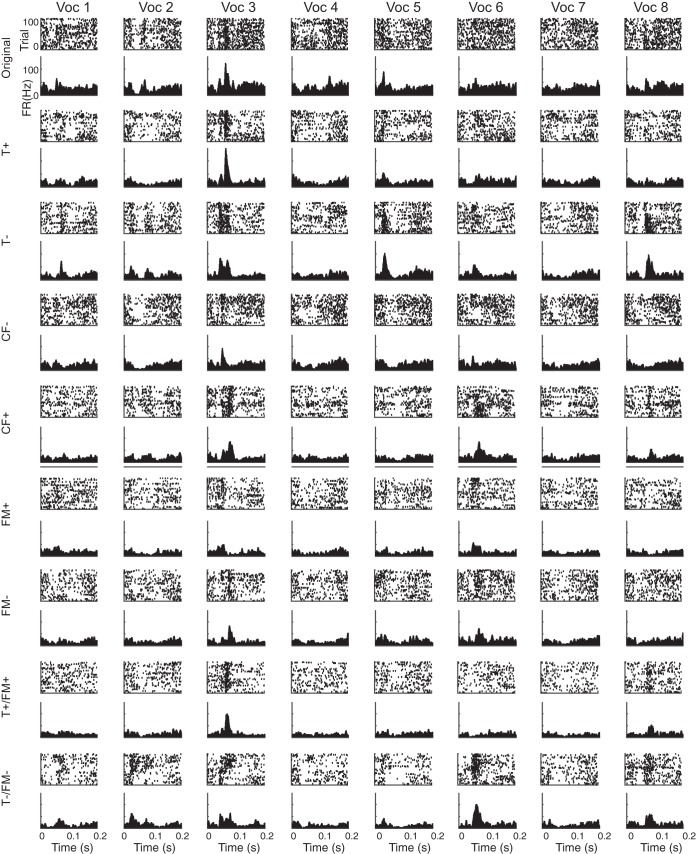
Fig. 3.
Peristimulus-time raster plots (above) and histograms (below) of an exemplar A1 unit showing selective responses to vocalization stimuli. Each column corresponds to one original vocalization, and every two rows to one transformation of that vocalization. Histograms were first computed for 1-ms time bins, and then smoothed with 11-ms Hanning window.

