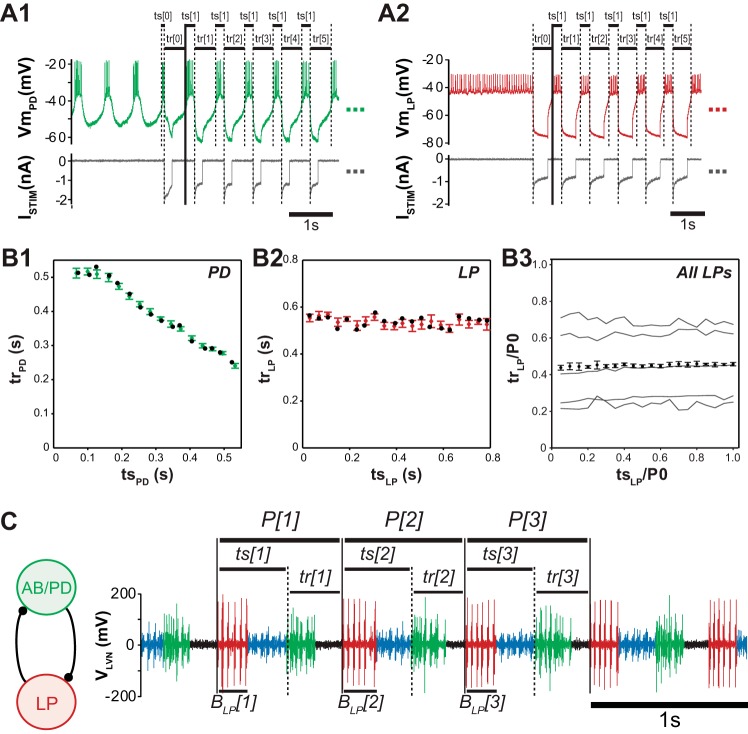
Fig. 1.
Measurement of recovery interval (tr)/stimulus time (ts) curves and firing intervals in the pyloric network. A1: tr/ts curve measurement from intracellular pyloric dilator neuron (PD) proceeds by repeatedly stimulating with an artificial synaptic input generated with dynamic clamp at a given ts, then repeating for each ts to be measured. A2: tr/ts measurement in nonbursting lateral pyloric neuron (LP). B1: resulting response intervals are tabulated into the tr/ts curve for PD, exhibiting typical tr/ts curve shape for PD (green points are mean ± SD for each ts; black dots are the first response intervals recorded at each new stimulus interval whose similarity to average values are indicative of negligible second-order resetting). B2: tr/ts curve tabulated from LP (red points are mean ± SD for each ts; black dots are the first response intervals recorded for each new stimulus interval, suggesting that LP also exhibits negligible second-order “resetting”). B3: LP exhibits a flat tr/ts curve, corresponding to a constant response interval independent of stimulus interval (N = 5 animals). Thin black lines show individual tr/ts curves as linearly interpolated means, normalized by each pyloric network's intrinsic period P0. Red points show the mean tr/ts curve (mean ± SE, adjusted for pairwise comparisons). C: extracellular voltage trace showing stereotypical activity of the pyloric pacemaker unit anterior burster (AB)/PD (light green, 1 AB and 2 PDs) and follower neurons LP (red), which are connected with reciprocal inhibitory synapses and burst in a periodic firing pattern lead by AB/PD. PY follower neurons (blue spikes) are also present in the pyloric circuit, but their effect on LP is ignored. LP stimulus intervals (ts[i]) measure timing of synaptic input from AB/PD relative to the start of each cycle period P[i], and response intervals (tr[i]) measure the corresponding timing of LP's next burst relative to synaptic input from AB/PD. Because LP's tr/ts curve was found to be flat in B, the mean LP response interval measured in extracellular activity is an estimate of LP's tr/ts curve. Periods, firing intervals, and LP burst durations BLPi were also measured and averaged to inform our hybrid networks such that they operate with pyloric-like activity.

