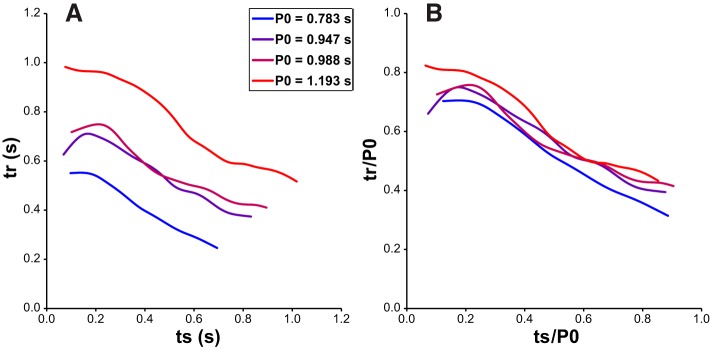
Fig. 5.
Experimental test of the assumed invariance of the tr/ts curve. A: the tr/ts curve of 1 PD was measured 4 different times over multiple hours, during which an increase in intrinsic period occurred. B: plots of the normalized curves show that tr/ts curve shape is largely invariant with the observed changes in intrinsic PD period.

