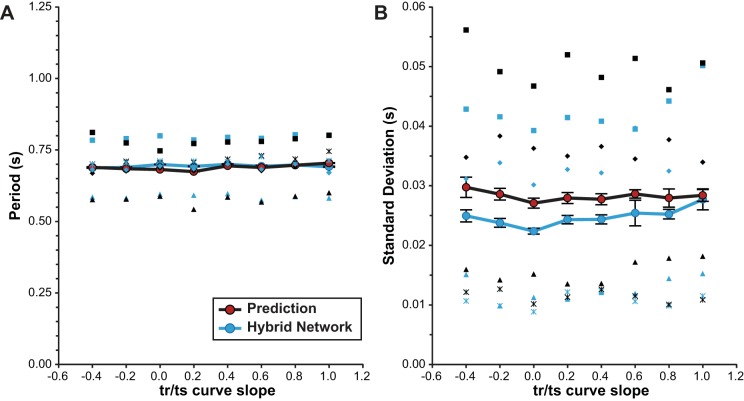
Fig. 8.
Comparison of predicted to observed network period and variability. Experiments for which predictions and observations of period and variability were made and no strong autocorrelation was present are compared (n = 4). Individual measurements of both observed hybrid network activity (blue) and predicted activity (black) were plotted (using the same symbols for results from the same preparation) and averaged (large circles), showing good correspondence between predictions and observed hybrid network activity. Error bars: ±1 SE for repeated-measures data.

