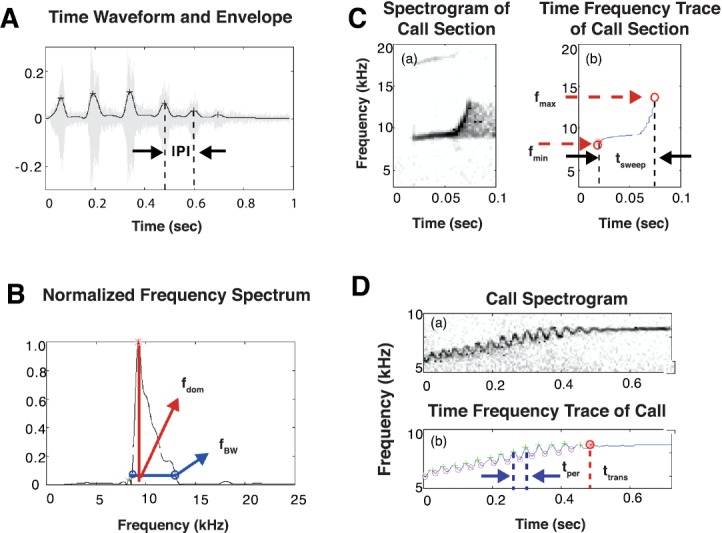
FIG. 2.

(Color online) Signal representations used to measure the acoustic features described in Table I, with representative feature measurements for each signal representation shown. (A) Time waveform (gray) and envelope (black) of a twitter call, with detected envelope peaks marked with “+” symbols. (B) Smoothed magnitude of the frequency spectrum for the beginning phrase of a twitter call. The “*” symbol marks the detected spectral peak. (C) Spectrogram and time-frequency trace for the beginning phrase of a twitter call. The minimum and maximum detected frequencies are shown along with the sweep time. (D) Spectrogram and time-frequency trace for a trillphee call. The + markers indicate detected peaks in the FM sinusoid segment of the call, the “O” markers indicate detected troughs in the FM sinusoid segment of the call, and the O marker indicates where the transition point from the FM sinusoidal to tonal segment of the call was detected. The markers in all signal representations were generated using automated feature detection software.
