
Fig. 2.
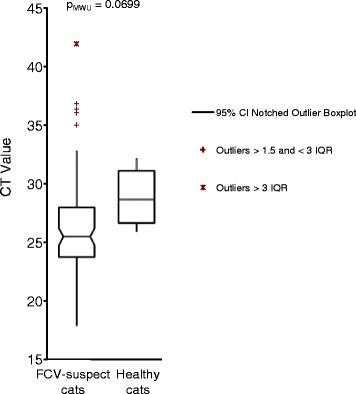
Comparison of FCV loads in the swab/cytobrush samples from FCV-suspect cats and the healthy cats. Loads are given as CT values from the real-time RT-qPCR S1 assay and are depicted as boxplots. A low CT value corresponds to a high load. Of note, the measurements are semi-quantitative because of the collection procedure (cytobrushes and swabs)