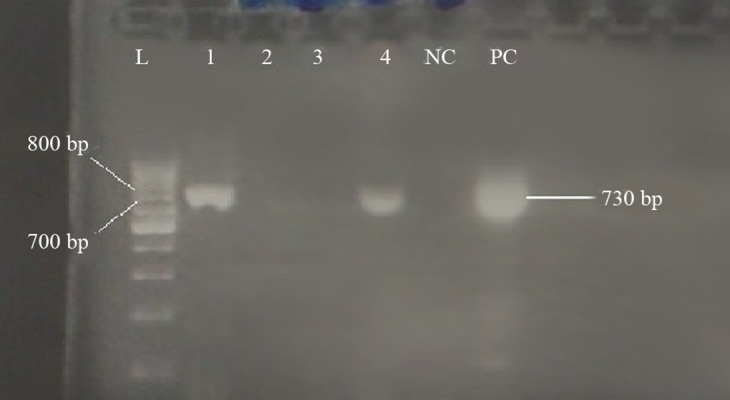
Figure 2. PCR results of HBV pre-core/core region with a 730 bp PCR product.

L: 100 bp DNA ladder, NC: negative control, PC: positive control, 1 to 4: patient’s sera.

L: 100 bp DNA ladder, NC: negative control, PC: positive control, 1 to 4: patient’s sera.