Fig. 1.

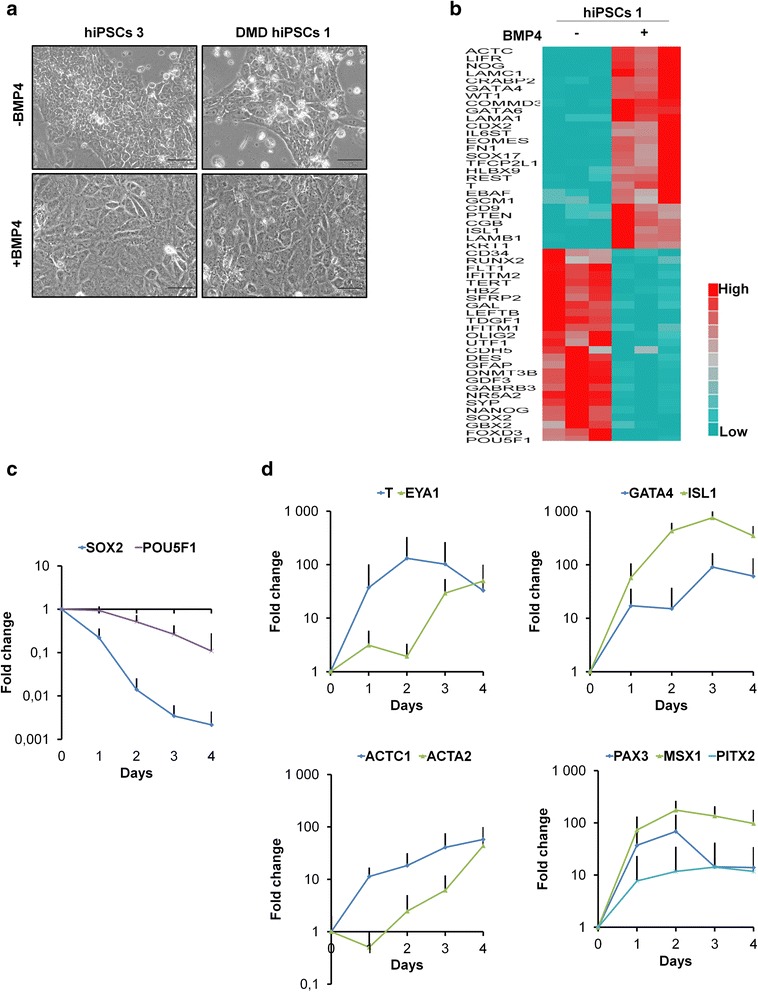
BMP4 treatment induces mesoderm lineage markers in hiPSCs/hESCs. a Examples of morphology in hiPSCs 3 and DMD hiPSCs 1 at day 4 either without or after a single BMP4 treatment. Scale bar = 50 μm. b TaqMan® Human Stem Cell Pluripotency Array data showing 2-dCT of lineage marker genes in hiPSCs 1 at day 3 either without or after a single BMP4 treatment. Genes selected for display showed a minimum of ±2 fold change on relative quantifications (RQs) calculation in BMP4-treated hiPSCs 1, as compared to hiPSCs 1 without BMP4 treatment (p < 0.05; based on a Student’s t test). c and d Quantitative RT-PCR of c pluripotency and d early mesoderm specific genes. Curves represent the mean ± SD (standard deviation) from nine pluripotent stem cell lines (hPSCs) at days 0 through 4 after BMP4 treatment. Gene expression was normalized to the mean of glyceraldehyde-3-phosphate dehydrogenase (GAPDH) and ubiquitin C (UBC) and plotted (log10 scale) relative to the mean expression of all pluripotent stem cells at day 0 (D0)
