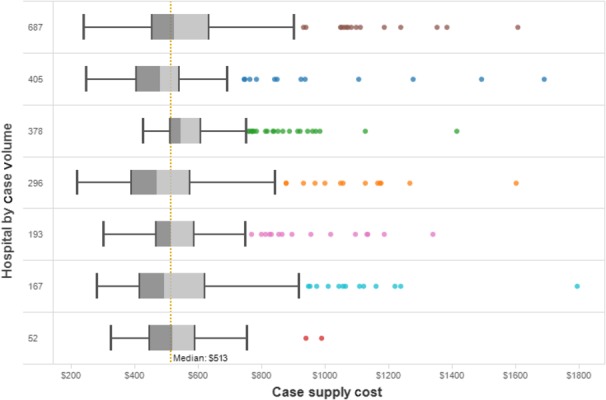
Figure 1.

Intra-operative supply cost per case. The distribution of case costs for each of seven hospitals is outlined by row. Box plots depict 25th percentile, median and 75th percentile. Whiskers represent 1.5× interquartile (IQR), and dots represent high outliers. The system median cost of $513 is depicted as a dotted vertical line. Hospitals are sorted by case volume in the period as per the numbers in the first column. Investigation of high outlier cases identified the use of energy devices as a common cause of high case cost
