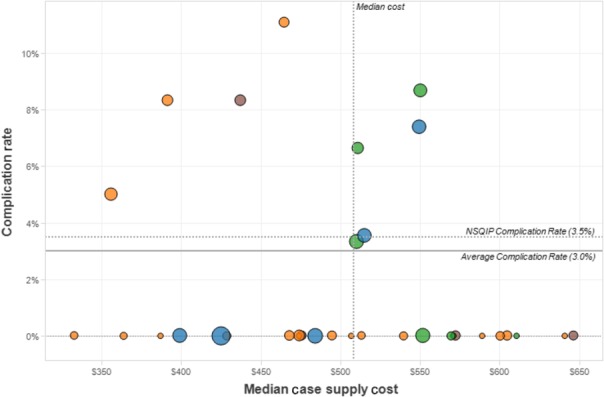
Figure 3.

Surgeon-specific median expenditure versus any National Surgical Quality Improvement Program (NSQIP) adverse events. Surgeon expenditure is compared with the health system complication rate (‘average rate’ = 3%) and the national American College of Surgeons (ACS) NSQIP complication rate (‘NSQIP rate’ = 3.5%) during the study period. The area of circles represents surgeon case volume and colour represents hospital affiliation. There is no obvious negative or positive correlation between cost and outcomes
