
Figure 3. Effect of YAP on the anchorage-independent growth of normal and cancerous cervical cells.
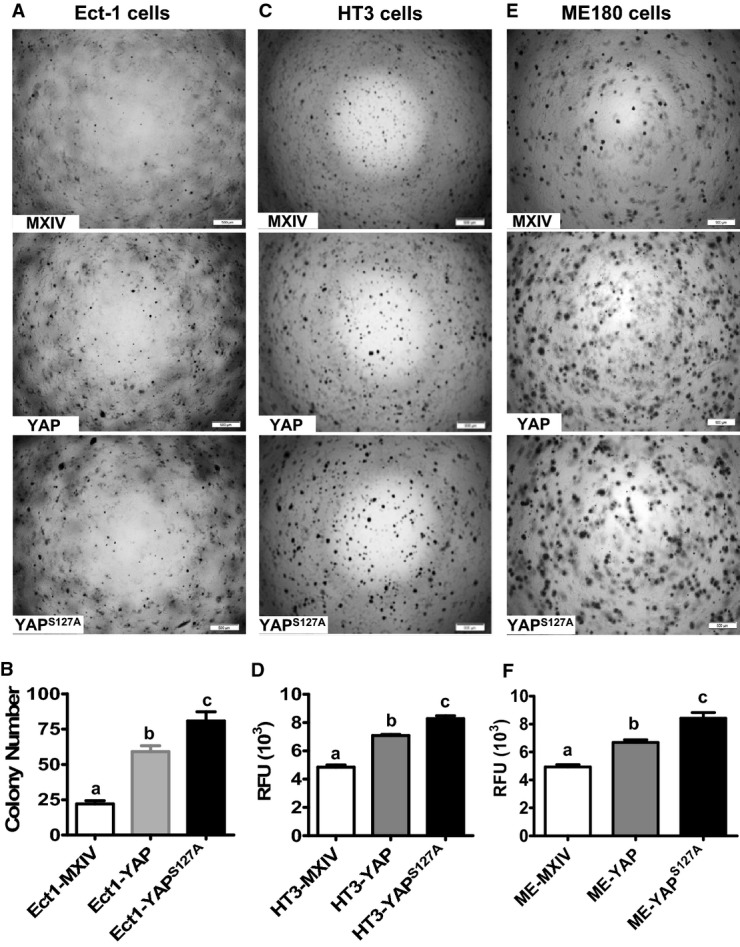
- A Representative images showing colonies formed by Ect1-MXIV, Ect1-YAP, and Ect1-YAPS127A cells after growth in soft agar for 9 days. Scale bar: 500 μm.
- B Quantitative data showing colony formation in Ect1-MXIV, Ect1-YAP, and Ect1-YAPS127A cells. Each bar represents mean ± SEM of five independent experiments. Bars with different letters are significantly different from each other (Ect1-MXIV vs. Ect1-YAP, P = 0.0003; Ect1-MXIV vs. Ect1-YAPS127A, P = 0.0002).
- C, E Representative images showing the anchorage-independent growth of YAP-expressing HT3 (C) and ME180 (E) cervical cancer cell lines. Anchorage-independent cell growth was determined by the soft agar colony formation assay. Scale bar: 500 μm.
- D, F Fluorescence-based quantitative analysis showing the differences of anchorage-independent growth in HT3-MXIV, HT3-YAP, and HT3-YAPS127A (D) and ME180-MXIV, ME180-YAP, and ME180-YAPS127A cells (F). The anchorage-independent cell growth was determined using a CytoSelect 96-Well Cell Transformation Assay kit, and data are presented as relative fluorescent units (RFU). Each bar represents mean ± SEM of four independent experiments. Bars with different letters are significantly different from each other (HT3-MXIV vs. HT3-YAP, P = 0.0002; HT3-MXIV vs. HT3-YAPS127A, P < 0.0001; ME-MXIV vs. ME-YAP, P = 0.0011; ME-MXIV vs. ME-YAPS127A, P = 0.0013).
Data information: Data in (B), (D), and (F) were analyzed for significance using one-way ANOVA in GraphPad Prism 5 with Tukey’s post hoc tests. Source data are available online for this figure.