
Figure 6. TGF-α regulates the Hippo signaling pathway in cervical cancer cells.
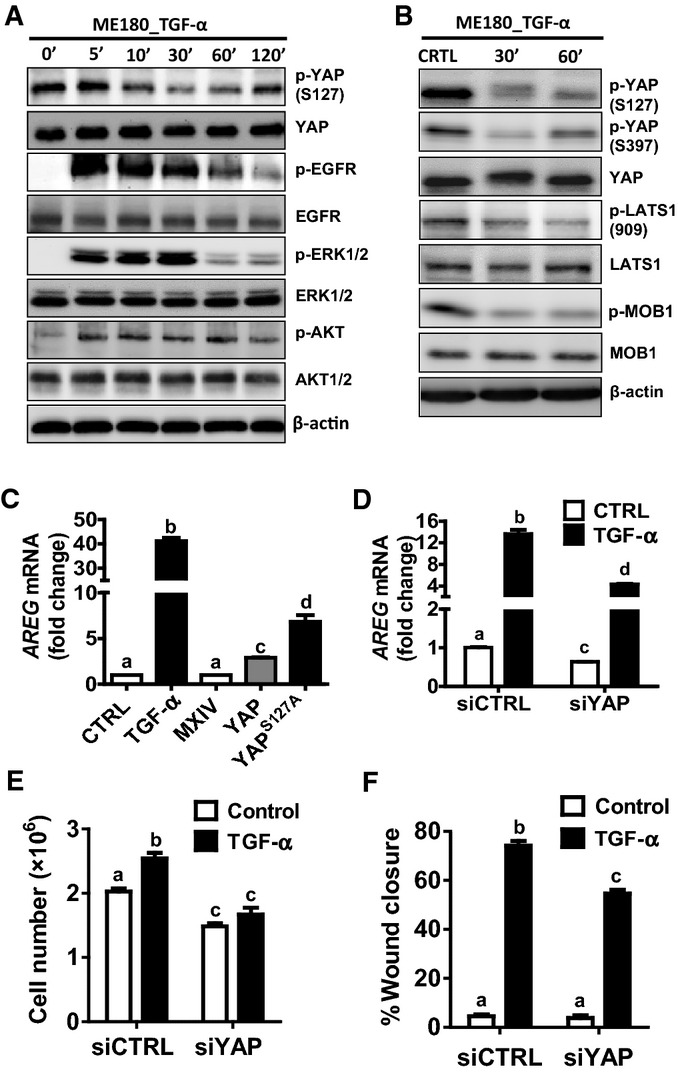
- Western blot analysis showing effects of TGF-α on phosphorylation of EGFR, YAP, AKT, and ERK1/2. ME180 cells were starved for 6 h after reaching cell confluence, then cells were treated with TGF-α (100 ng/ml) for 0, 5, 10, 30, 60 or 120 min.
- Western blot analysis showing effects of TGF-α on the phosphorylation of the components of the Hippo signaling pathway. ME180 cells were starved for 6 h after reaching cell confluence, then cells were treated with TGF-α (100 ng/ml) for 0, 30, 60 min.
- Real-time PCR determines the action of TGF-α and YAP levels on the mRNA expression of AREG. Each bar represents the mean ± SEM (n = 5). Bars with different letters are significantly different from each other (Ctrl vs. TGF-α, P < 0.0001; MXIV vs. YAP, P < 0.0001; MXIV vs. YAPS127A, P < 0.0001).
- Real-time PCR analysis showing that knockdown of YAP with YAP siRNA (siYAP) significantly suppressed TGF-α-induced (FBS 10%, TGF-α: 10 ng/ml for 48 h) AREG expression in ME180 cells. siCTRL, a non-targeting siRNA, was used as a negative control. Each bar represents the mean ± SEM (n = 5). Bars with different letters are significantly different from each other (siCTRL vs. siCTRL+TGF-α, P < 0.0001; siYAP+CTRL vs. siYAP+TGF-α, P < 0.0001; siCTRL+TGF-α vs. siYAP+TGF-α, P = 0.0067).
- Proliferation of ME180 cells (FBS 1%) treated with control (siCTRL) or YAP (siYAP) prior to treatment with control medium or TGF-α (10 ng/ml) for 108 h. Each bar represents the mean ± SEM (n = 4). Bars with different letters are significantly different from each other (siCtrl vs. siCTRL+TGF-α, P = 0.0058; siYAP+CTRL vs. siYAP+TGF-α, P = 0.1840; siCTRL+TGF-α vs. siYAP+TGF-α, P = 0.0013).
- Quantitative data of the wound-healing assay showing the migration of ME180 cells that were treated with control (siCTRL) or YAP siRNA (siYAP) prior to treatment with or without TGF-α for 12 h. Each bar in bar graphs represents the mean ± SEM (n = 4). Bars with different letters are significantly different from each other (siCtrl vs. siCTRL+TGF-α, P < 0.0001; siYAP+CTRL vs. siYAP+TGF-α, P < 0.0001; siCTRL+TGF-α vs. siYAP+TGF-α, P = 0.0041).
Data information: Data in (C–F) were analyzed for significance using one-way ANOVA in GraphPad Prism 5 with Tukey’s post hoc tests. Source data are available online for this figure.