
Figure 7. Function and expression of AREG in cervical cancer cells.
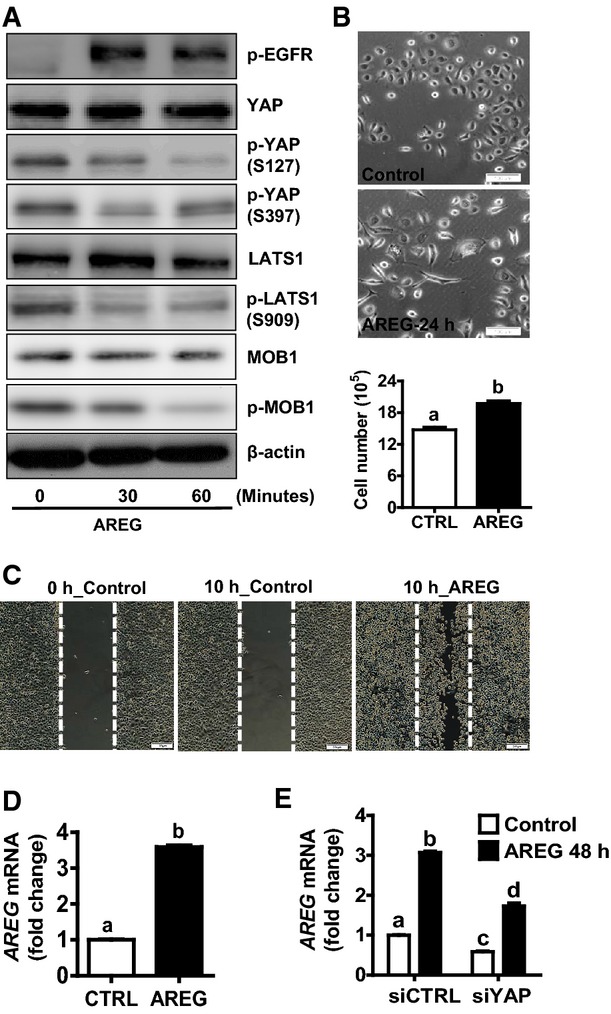
- Western blot analysis showing that AREG treatment induced dephosphorylation of LATS1, MOB1, and YAP. ME180 cells were starved for 6 h after reaching cell confluence, then cells were treated with AREG (50 ng/ml) for 0, 30, 60 min.
- AREG (50 ng/ml) treatment induced appearance of elongated cells in ME180 cells (top and middle panels) and significantly stimulated ME180 cell proliferation (lower panel). Each bar represents mean ± SEM (n = 5). Bars with different letters are significantly different from each other (P = 0.003). Scale bar: 100 μm.
- Wound-healing assay showing that AREG stimulates migration of ME180 cervical cancer cells within 10 h in serum-free medium. Scale bar: 200 μm.
- Real-time PCR showing that treatment of ME180 cells with AREG for 24 h significantly increased AREG mRNA expression. Each bar represents mean ± SEM (n = 9). Bars with different letters are significantly different from each other (P < 0.0001).
- Real-time PCR showing that knockdown of YAP in ME180 cells with YAP siRNA (siYAP) significantly suppressed AREG-induced AREG mRNA expression. siCTRL (non-target siRNA) was used as a siRNA control. Each bar represents mean ± SEM (n = 4). Bars with different letters are significantly different from each other (siCTRL vs. siCTRL+AREG, P < 0.0001; siYAP+CTRL vs. siYAP+AREG, P < 0.0001; siCTRL+AREG vs. siYAP+AREG, P = 0.0037).
Data information: Quantitative data in (B) and (D) were analyzed for significance using unpaired t-test in GraphPad Prism 5 with Welch’s correction. Data in (E) were analyzed for significance using one-way ANOVA in GraphPad Prism 5 with Tukey’s post hoc tests. Source data are available online for this figure.