
Figure 8. The Hippo/YAP and the ERBB pathways interact with each other to regulate cervical cancer cell growth.
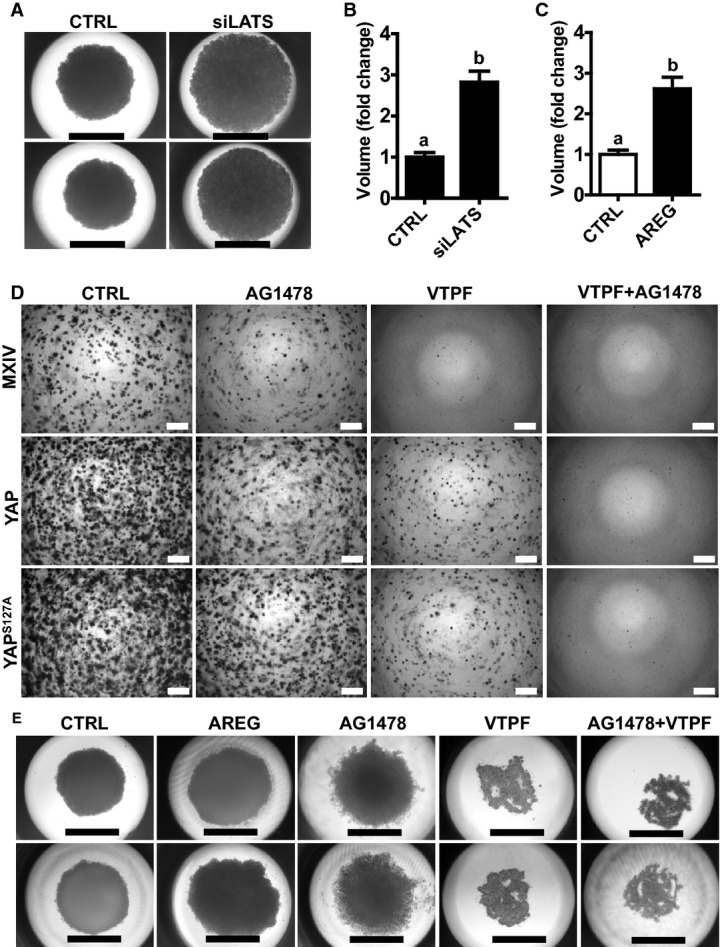
- Representative images showing the morphology of spheroids derived from ME180-siCtrl and ME180-siLATS1/2 cells growing in a 3D hanging-drop culture system for 10 days. Scale bar: 1.0 mm.
- Quantitative data showing changes in the volume of spheroids derived from ME180-siCTRL and ME180-siLATS1/2 cells growing in a 3D hanging-drop culture system. Each bar represents mean ± SEM (n = 5). Bars with different letters are significantly different from each other (P = 0.0004).
- Quantitative data showing changes in the volume of spheroids derived from ME180 cells growing in a 3D hanging-drop culture system in the absence or presence of AREG (20 ng/ml, 8 days). Each bar represents mean ± SEM (n = 5). Bars with different letters are significantly different from each other (P = 0.0030).
- Soft agar assay showing the effect of AG1478 and VTPF on colony formation in ME180-MXIV, ME180-YAP and ME180-YAPS127A cells. Scale bar: 500 μm.
- Representative images showing the effect of AREG, EGFR inhibitor (AG1478), and YAP antagonist verteporfin (VTPF) on the growth of ME180 cell in a 3D hanging-drop culture system. ME180 cells were incubated in the 3D hanging-drop culture system for 10 days in the absence or presence of AREG, AG1478 or verteporfin for 8 days. Scale bar: 1.0 mm.
Data information: Quantitative data in (B) and (C) were analyzed for significance using unpaired t-test in GraphPad Prism 5 with Welch’s correction. Source data are available online for this figure.