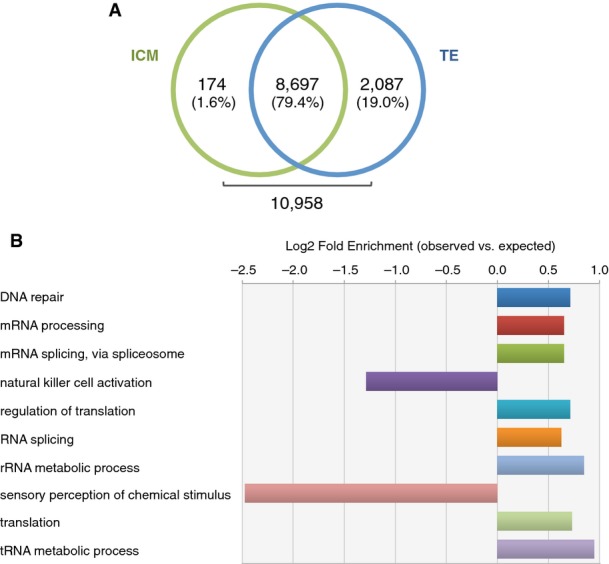
Blastocyst gene expression investigated using Panther database statistical overrepresentation test comparing global blastocyst transcript list to the default human whole-genome list, which included all genes present in the Panther database. Only biological processes of actively transcribed genes in the human blastocyst with fold enrichment < 0.5 and > 1.5 and
P-value < 0.01 are shown. Bar lengths are displayed as Log
2 of the ratio between observed and expected number of genes for each category. Raw data and
P-values for each category are shown in Table
EV3.