
Figure 1. Cumulative survival according to MICA-129 genotype.
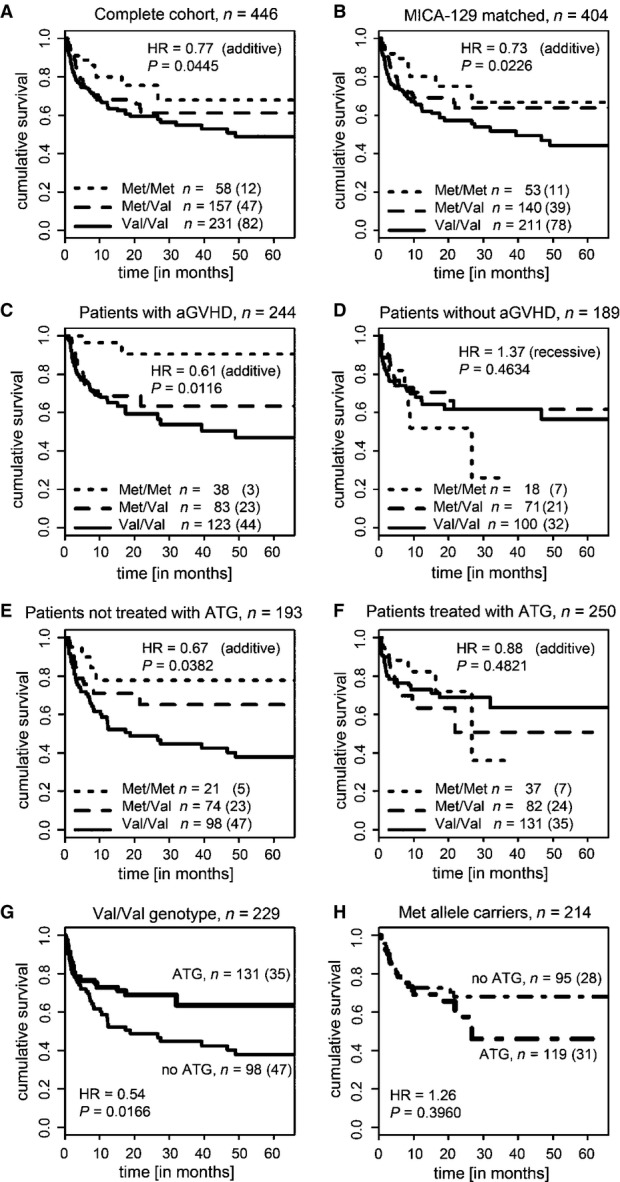
- Kaplan–Meier survival curves stratified by the patient MICA-129 genotype for all patients (n = 446). The survival curve is displayed for the first 66 months; 7.6% of the patients were followed longer. Effects on overall survival were determined by Cox regression with covariate adjustment as indicated in Table2. The HR indicates the risk per MICA-129Met allele carried by the patients (additive risk model). The numbers of patients carrying the three genotypes and the number of events (in brackets) are indicated.
- Kaplan–Meier survival curves for patients receiving a graft matched for the MICA-129 genotype (n = 404).
- Kaplan–Meier survival curves for patients who experienced aGVDH (any grade, n = 244).
- Kaplan–Meier survival curves for patients not experiencing aGVHD (n = 189). The HR indicates the risk of patients carrying two MICA-129Met alleles (recessive risk model).
- Kaplan–Meier survival curves for patients who did not receive a T-cell-depleting treatment with ATG (n = 193).
- Kaplan–Meier survival curves for patients treated with ATG (n = 250).
- Kaplan–Meier survival curves for patients with the MICA-129Val/Val genotype (n = 229) stratified by treatment with ATG.
- Kaplan–Meier survival curves for patients carrying one or two MICA-129Met alleles (n = 214) stratified by treatment with ATG.