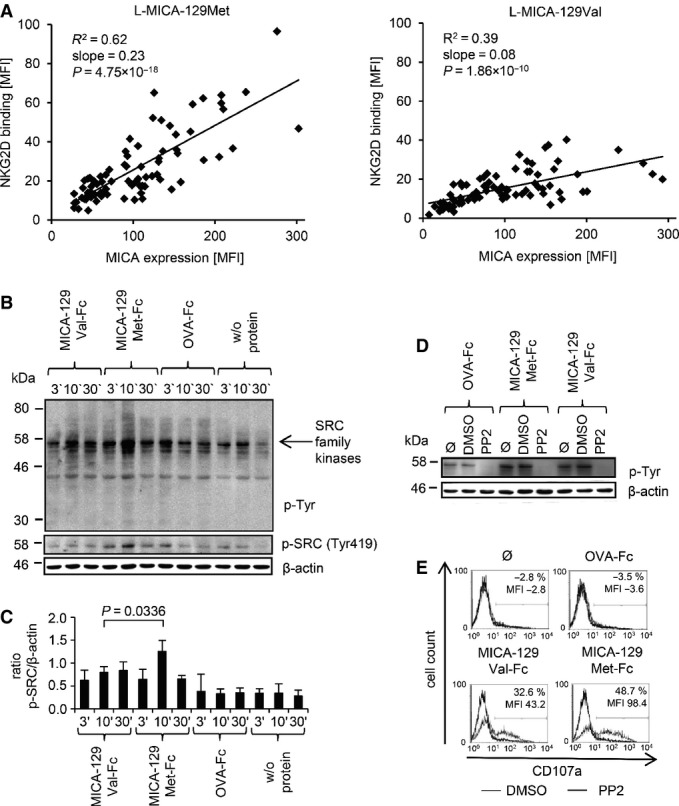
The linear regression of MICA expression intensity and binding of a recombinant NKG2D-Fc fusion protein both determined as MFI by flow cytometry is displayed for L-MICA-129Met (n = 79, left panel) and L-MICA-129Val clones (n = 81, right panel). The coefficients of determination (R2), the regression coefficients (reg. coeff.), and the P-values for Pearson correlation are indicated.
Purified IL-2-stimulated (100 U/ml for 4 days) NK cells (106) were stimulated with immobilized MICA-129Met-mIgG2a-Fc or MICA-129Val-mIgG2a-Fc or OVA-mIgG2a-Fc fusion proteins (10 μg/ml) for 3, 10, or 30 min. The protein lysates of these cells were separated by SDS–PAGE, and the blot was probed subsequently with an anti-phospho-Tyr mAb, an anti-phospho-SRC family (Tyr419) kinases Ab, and an anti-β-actin mAb as a loading control. The arrow points toward phosphorylated SRC family kinases.
Blots obtained from three independent experiments were analyzed by densitometry, and the means plus SD of the ratio between phospho-SRC family kinase and β-actin signals is displayed. The difference between NK cells stimulated for 10 min by MICA-129Met-Fc or MICA-129Val-Fc proteins was assessed by t-test.
Purified IL-2-stimulated NK cells (100 U/ml for 4 days, 106) were incubated with the SRC kinase inhibitor PP2 (25 μM), the vehicle DMSO, or medium only (Ø) for 30 min before being added to immobilized MICA-129Met-Fc, MICA-129Val-Fc, or OVA-Fc fusion proteins (10 μg/ml) for 10 min. The protein lysates of these cells were separated by SDS–PAGE, and the blot was probed subsequently with an anti-phospho-Tyr mAb and an anti-β-actin mAb as a loading control. The blot is representative for two independent experiments.
In parallel, degranulation of the NK cells was measured by anti-CD107a staining in flow cytometry. The difference between DMSO- and PP2-treated cells with respect to CD107a+ cells and the MFI of CD107a is indicated in the histograms. The results are representative for two independent experiments.

