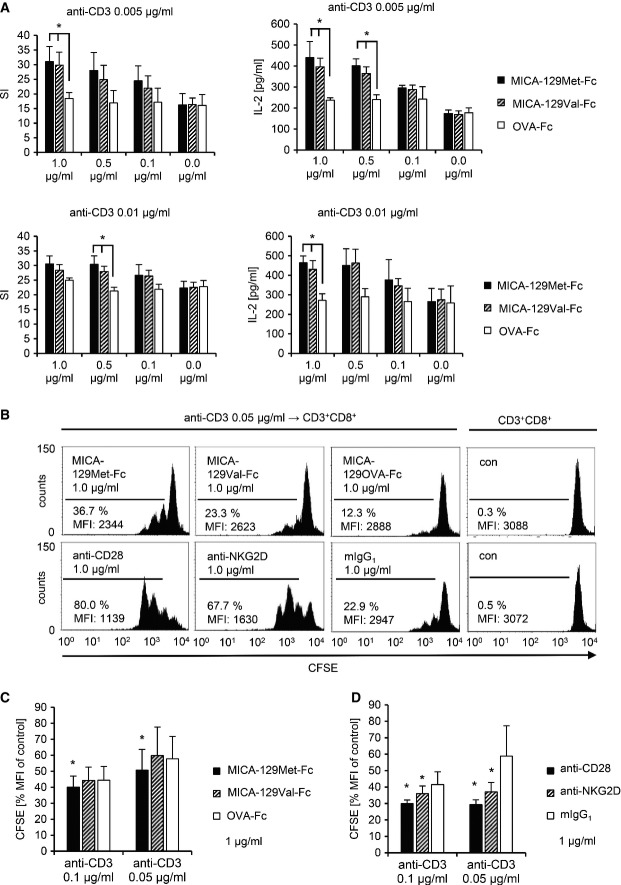
MACS-separated CD8+ T cells were cultured in triplicate on an immobilized anti-CD3 mAb (0.005 μg/ml [upper panel] or 0.01 μg/ml [lower panel]) in combination with recombinant MICA-129Met-Fc, MICA-129Val-Fc, and OVA-Fc proteins at various concentrations (1.0, 0.5, 0.1, 0.0 μg/ml). After 72 h, 25% of the supernatant was harvested and IL-2 concentrations were measured by ELISA. The harvested medium was replaced by the same volume containing 1 μCi 3H-labeled thymidine. After 12 h, the plates were completely harvested and the DNA-bound radioactivity was determined. The means and SD of the stimulation index (SI) are displayed (n = 4). Significant differences between MICA-129Met/Val-Fc and OVA-Fc proteins were found when the antigen-specific signal (anti-CD3) was limited (*P < 0.05, t-test; upper left panel: 1.0 μg/ml: MICA-129Met-Fc versus OVA-Fc P = 0.0372 and MICA-129Val-Fc versus OVA-Fc P = 0.0366; upper right panel: 1.0 μg/ml: MICA-129Met-Fc versus OVA-Fc P = 0.0499 and MICA-129Val-Fc versus OVA-Fc P = 0.0192; 0.5 μg/ml: MICA-129Met-Fc versus OVA-Fc P = 0.0164 and MICA-129Val-Fc versus OVA-Fc P = 0.0357; lower left panel: 0.5 μg/ml: MICA-129Met-Fc versus OVA-Fc P = 0.0287 and MICA-129Val-Fc versus OVA-Fc P = 0.0232; lower right panel: 1.0 μg/ml: MICA-129Met-Fc versus OVA-Fc P = 0.0171 and MICA-129Val-Fc versus OVA-Fc P = 0.0484).
Purified CFSE-stained CD8+ T cells were stimulated by immobilized anti-CD3 (0.005 μg/ml) in combination with recombinant MICA-129Met-Fc, MICA-129Val-Fc, OVA-Fc proteins, or co-stimulatory mAb (anti-CD28, anti-NKG2D) or an isotype control (mIgG1). The proliferation of CD3+CD8+ T cells was assessed at 60 h by flow cytometry. Results of a representative out of 6 experiments are displayed. Untreated CFSE-stained CD8+ T cells are included for comparison. The percentage of proliferating cells and MFI for CFSE are indicated.
The MFI of CFSE in unstimulated CD8+ T cells (control) was set to 100% in individual experiments (n = 6), and the relative decrease due to proliferation was calculated. Means + SD are shown. Significant differences (*P = 0.0277, Wilcoxon test) between MICA-129Met-Fc versus MICA-129Val-Fc and OVA-Fc proteins were found at slightly higher anti-CD3 concentrations (0.1 and 0.05 μg/ml) than at later time points (see A).
Anti-CD28 and anti-NKG2D mAb were used in parallel as a positive control, mean + SD are shown, and significant differences (*P = 0.0277, Wilcoxon test) to the isotype control (mIgG1) are indicated (n = 6).

