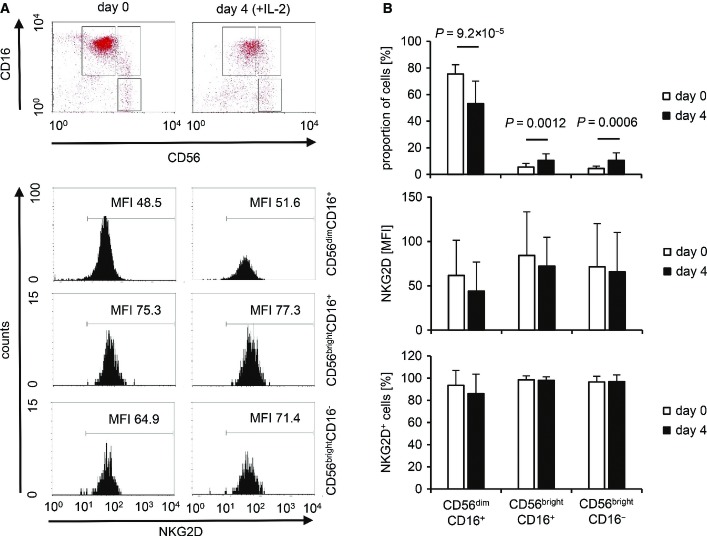
Figure EV1. NKG2D expression on freshly isolated and IL-2-stimulated NK-cell populations.
- Three populations (CD56dimCD16+, CD56brightCD16+, CD56brightCD16−) were gated on freshly isolated NK cells (day 0) and NK cells stimulated for 4 days with IL-2 (100 U/ml) as exemplified in the upper panel. The NKG2 D expression on these NK-cell populations is displayed in the lower panel, and the MFI for NKG2D is indicated.
- Summaries (means + SD) of the proportion of the three NK-cell populations and their NKG2D expression intensity (MFI and percentage NKG2D+ cells) at day 0 (n = 21) and 4 days after IL-2 stimulation (n = 16) are shown. The data were analyzed by t-test, and the P-values of significant differences are indicated.

