Fig. 5.
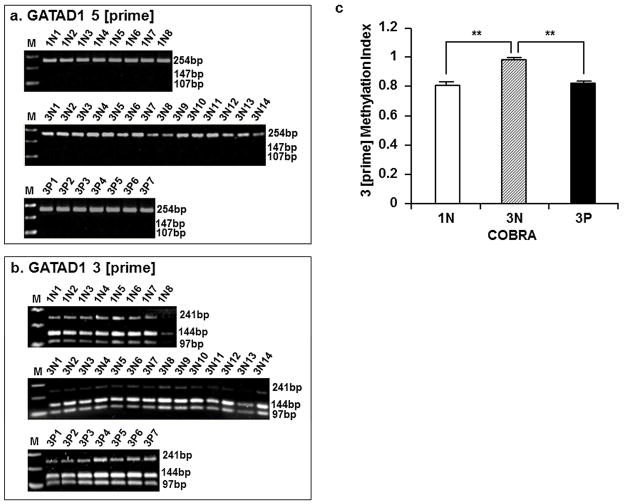
GATAD1 gene methylation measured by COBRA. Following PCR amplification, DNA fragments representing the 5 [prime] and 3 [prime] regions of GATAD1 gene were digested with an excess of BstUI or TaqαI, respectively. Agarose gel electrophoresis was performed and DNA bands were visualized by ethidium bromide staining. a The absence of cleavage product (supposedly 147 bp and 107 bp) from 254 bp fragment indicated an largely unmethylated status of GATAD1 5 [prime] region in first-trimester (1N1 to 1N8), third-trimester normal (3N1 to 3N14) and Preeclamptic (3P1 to 3P7) placentas. b The 241 bp fragment representing the 3 [prime] region of GATAD1 was mostly cleaved, generating the 144 bp and 97 bp bands indicative of DNA methylation. c Densitometry analyses of the 3 [prime] methylation showing an increased methylation in 3N placentas compared to 1N, and decreased methylation levels in 3P placentas compared to 3N group. ** p < 0.01.

