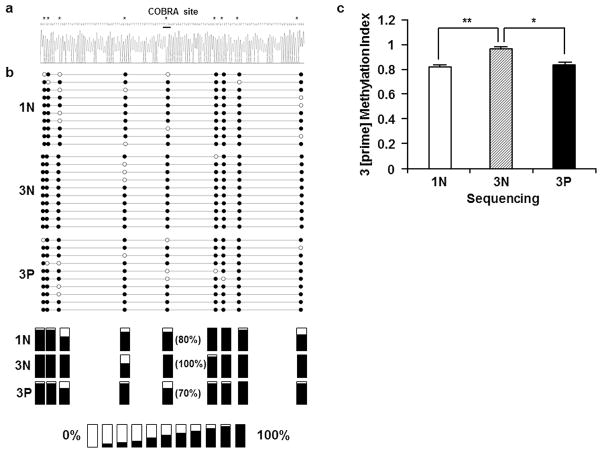
Fig. 6.
Bisulfite sequencing of the GATAD1 3 [prime] region. Bisulfite-converted DNA from 1N (n=5), 3N (n=5) and 3P (n=5) groups were PCR amplified, subcloned, and sequenced. a The typical sequencing result of the 3 [prime] region. Asterisks (*) mark CpG sites. The TaqαI recognition site used in COBRA is underlined. b GATAD1 3 [prime] bisulfate sequencing results. The solid and open circles represent the methylated and unmethylated cytosines, respectively, in CpGs dinucleotides contexts. The average methylation levels for each CpG site were presented in the bottom panels. c Quantitative comparison of the GATAD1 3 [prime] methylation among the three groups. 3N placentas displayed increased methylation levels compared to 1N, and 3P group exhibited decreased methylation levels compared to 3N. * p < 0.05; ** p < 0.01.

