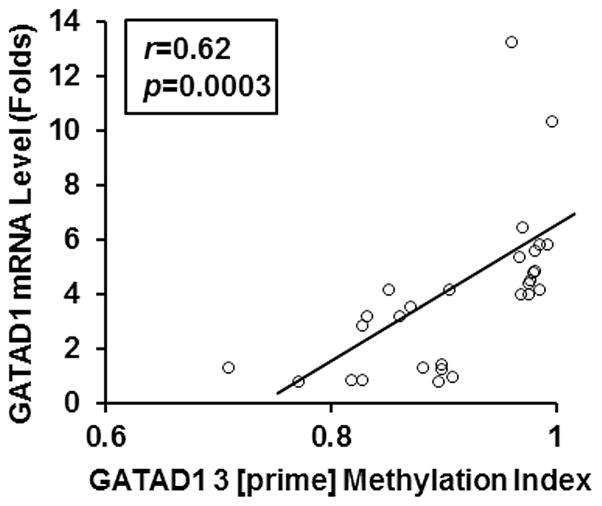
Fig. 7.
The correlation between GATAD1 expression and GATAD1 3 [prime] methylation in human placentas (n=29). The Y-axis indicated GATAD1 mRNA levels and the X-axis represented GATAD1 3 [prime] methylation index. Spearman correlation analysis showed a highly significant positive correlation between GATAD1 mRNA levels and GATAD1 3 [prime] methylation levels among placental samples (r=0.62, p=0.0003).

