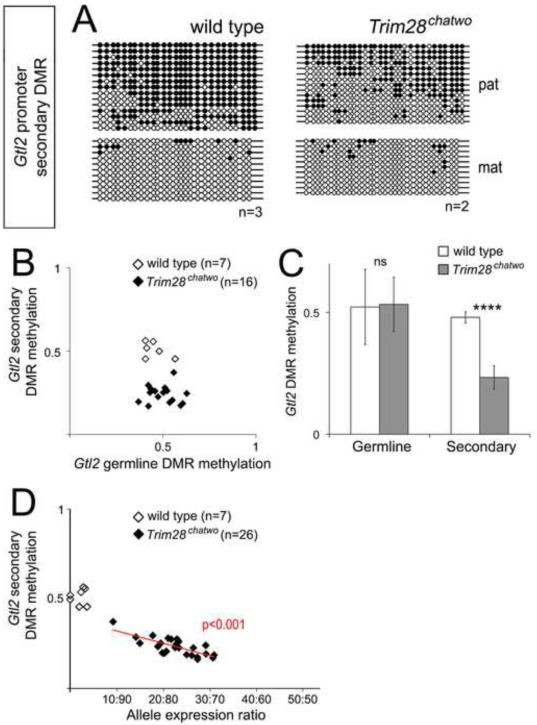
Figure 5. DNA methylation at the Gtl2 secondary DMR correlates with biallelic expression in Trim28chatwo mutants.
DNA methylation at the Gtl2 secondary DMR was measured in single E8.5 wild type and Trim28chatwo embryos by bisulfite sequencing (A) and pyrosequencing (B-D). (A) Representative bisulfite sequencing results for wild type and Trim28chatwo embryos, additional results are shown in Figure S3. Bisulfite sequencing in A and Figure S3 shows results from Trim28chatwo embryos that biallelically expressed Gtl2. Filled circles, methylated DNA. Empty circles, unmethylated DNA. Maternal (mat) and paternal (pat) chromosomes were identified by allele-specific SNPs. (B) DNA methylation at the germline IG-DMR versus the Gtl2 secondary DMR as measured by pyrosequencing in single wild type and Trim28chatwo embryos. (C) Average DMR methylation for all wild type and Trim28chatwo embryos analyzed. (D) Gtl2 allele expression ratios versus Gtl2 secondary DMR methylation as measured by pyrosequencing in single wild type and Trim28chatwo embryos. The red line in D shows the linear regression model for Trim28chatwo embryos. The P-value (red) indicates the correlation between biallelic expression and DNA methylation. The data represented in B-D includes the same E8.5 wild type and Trim28chatwo embryos as shown in Figure 4C. n = number of embryos analyzed. Error bars represent standard deviation. Statistical significance was measured using a paired student’s t-test, ns-not significant, ****p<0.0001.

