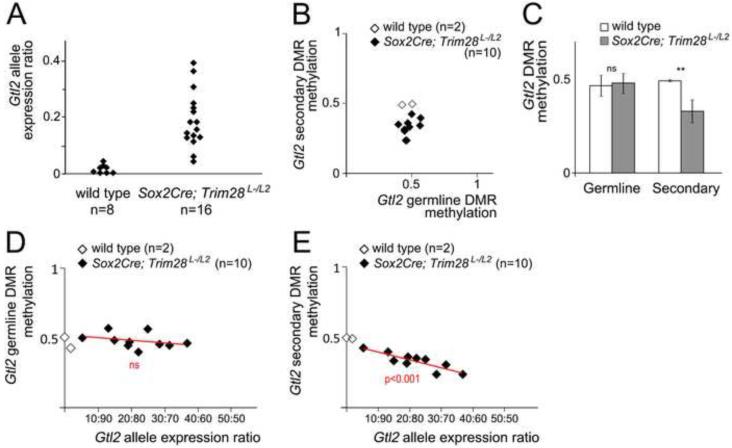
Figure 6. Gtl2 DMR methylation and imprinted gene expression in Sox2Cre;Trim28L-/L2 embryos.
(A) PeakPicker allelic expression ratios for Gtl2 in single E8.5 wild type and Sox2Cre;Trim28L-/L2 embryonic tissues. (B) Germline IG-DMR methylation versus Gtl2 secondary DMR methylation in E8.5 wild type and Sox2Cre;Trim28L-/L2 embryonic tissues. (C) Average DMR methylation in wild type and Sox2Cre;Trim28L-/L2 embryos. Error bars represent standard deviation. Statistical significance was measured using a paired student’s t-test: ns-not significant, **p<0.01. (D-E) Gtl2 allele expression ratio versus Gtl2 germline DMR methylation (D) and Gtl2 secondary DMR methylation (E) in wild type and Sox2Cre;Trim28L-/L2 embryos. Red lines show the linear regression model for Sox2Cre;Trim28L-/L2 embryos. P-value indicates the correlation between biallelic expression and DNA methylation, ns-not significant. n = number of embryos analyzed.

