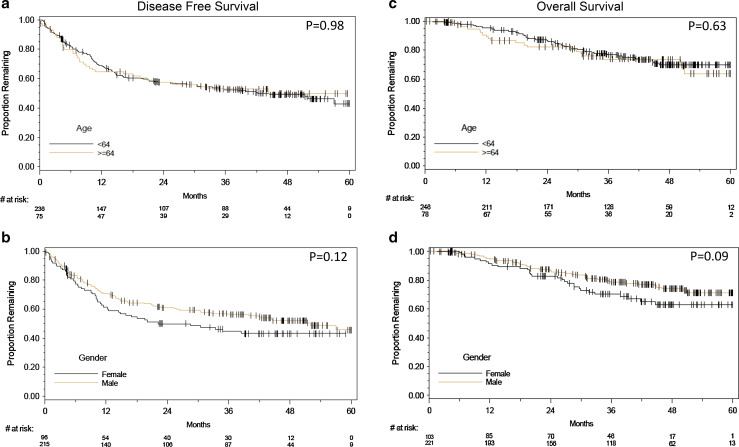
Fig. 3 .
Kaplan–Meier survival graphs of age (top) and gender (bottom) versus disease-free survival (DFS) and overall survival (OS) starting at 8 weeks to maximum of 60 months follow-up period. DFS is shown on the left column and OS on the right column. a Association between age and DFS, b effect of gender on DFS, c age versus overall survival, d gender versus overall survival

