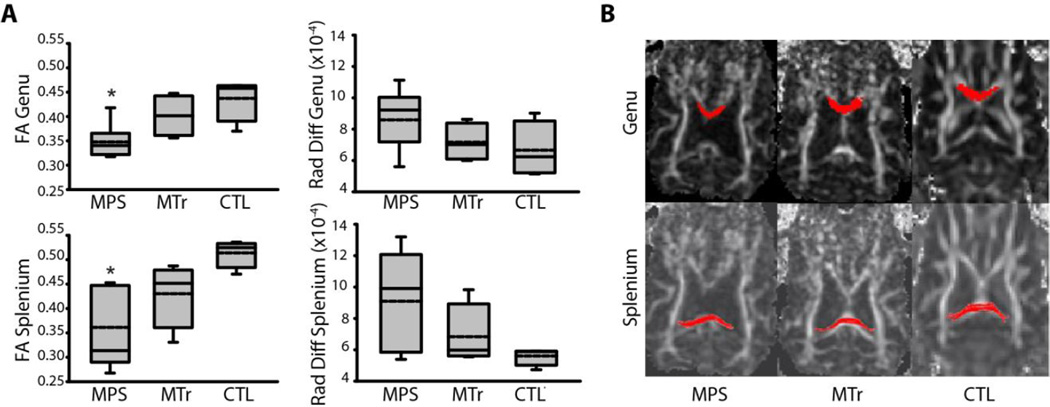
Fig. 1.
DTI of the corpus callosum. (A) Box plots of fractional anisotropy (FA) and radial diffusivity (Rad Diff) in the corpus callosum of untreated MPS I (MPS); MPS I dogs treated with intrathecal recombinant human alpha-l-iduronidase from age 4–21m (MTr); and unaffected heterozygote controls (CTL). Solid lines (the middle, lower and upper horizontal lines of the box) depict the median, 25th and 75th percentiles. Whiskers (the vertical lines and caps extending from the boxes) show the 10th and 90th percentiles. Dashed lines inside the boxes show the arithmetic means. *P < 0.01 vs. CTL. (B) Diffusion-weighted axial MR images illustrating the regions of interest that we used for tractography. The red color depicts regions corresponding to the genu (top panels) and splenium (lower panels) of the corpus callosum.

