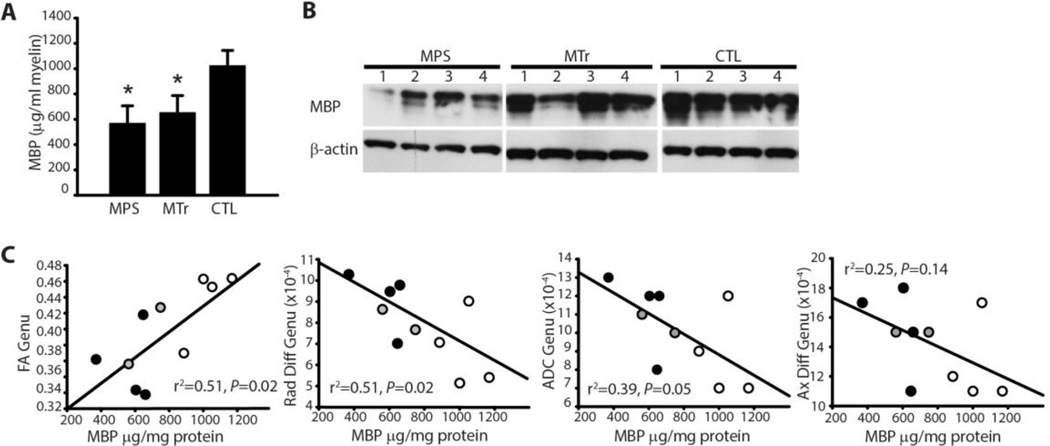
Fig. 2.
Myelin basic protein and relationship to DTI metrics. (A) Bar graph showing mean ± SD of myelin basic protein of myelin extracted from untreated MPS I (MPS), treated MPS I (MTr) and untreated heterozygous control dogs (CTL) per ml of extracted myelin. *P < 0.05 vs. CTL. Values for genu and splenium from each dog were averaged. (B) Western blot of myelin basic protein (MBP) in myelin extracted from the corpus callosum. Numbers 1–4 correspond to MPS1, MPS2, etc. dogs in Fig. 4. β-actin is shown as a control. (C) Scatterplots showing fractional anisotropy (FA), radial diffusivity (Rad Diff), apparent diffusion coefficient (ADC) and axial diffusivity (Ax Diff) of the genu of the corpus callosum measured by DTI vs. MBP quantified from extracted myelin in MPS (black circles), MTr (gray circles), and CTL (open circles) dogs. Linear regression was performed with MBP as the dependent variable.

